A very detailed Greenpeace report, authored by Greenpeace USA, the Gulf Coast Center for Law and Policy and The Movement for Black Lives.
Executive Summary
Fossil fuels — coal, oil, and gas — lie at the heart of the crises we face, including public health, racial injustice, and climate change. This report synthesizes existing research and provides new analysis that finds that the fossil fuel industry contributes to public health harms that kill hundreds of thousands of people in the U.S. each year and disproportionately endanger Black, Brown, Indigenous, and poor communities. President Joe Biden and the 117th Congress have a historic opportunity to improve public health, tackle the climate crisis, and confront systemic racism at the same time by phasing out fossil fuel production and use.
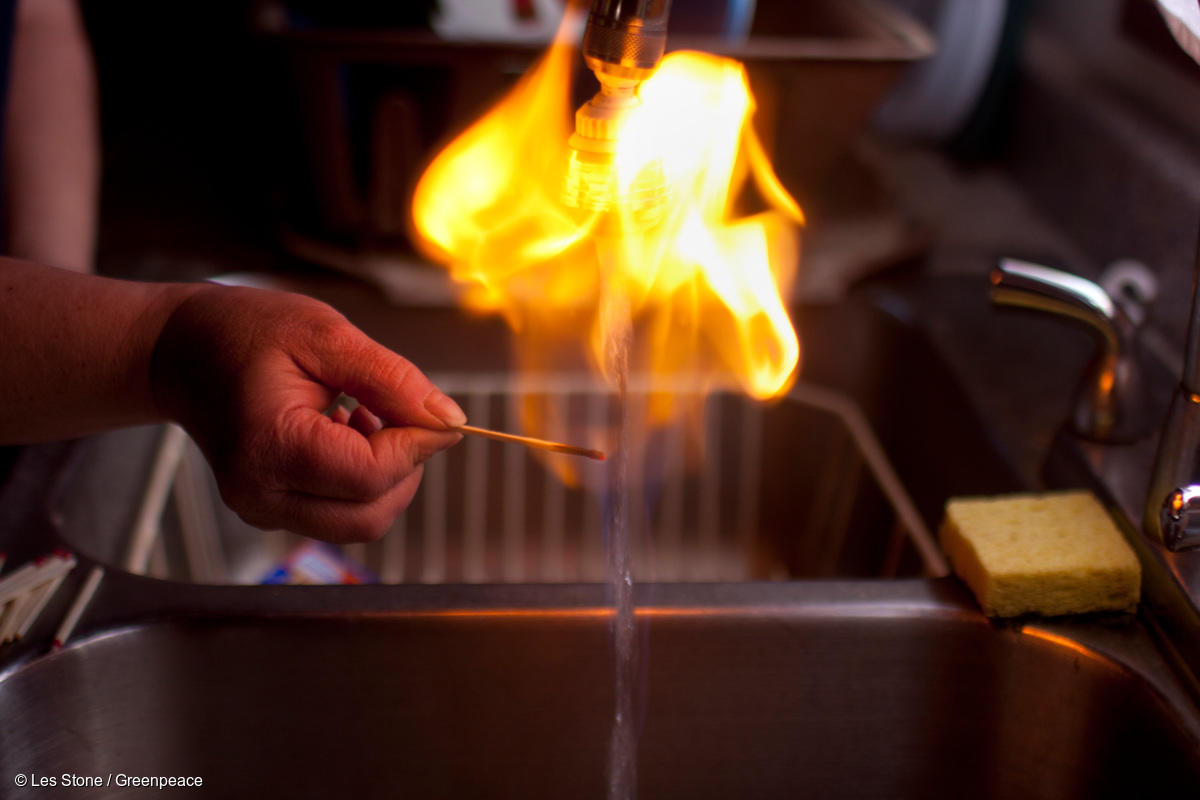
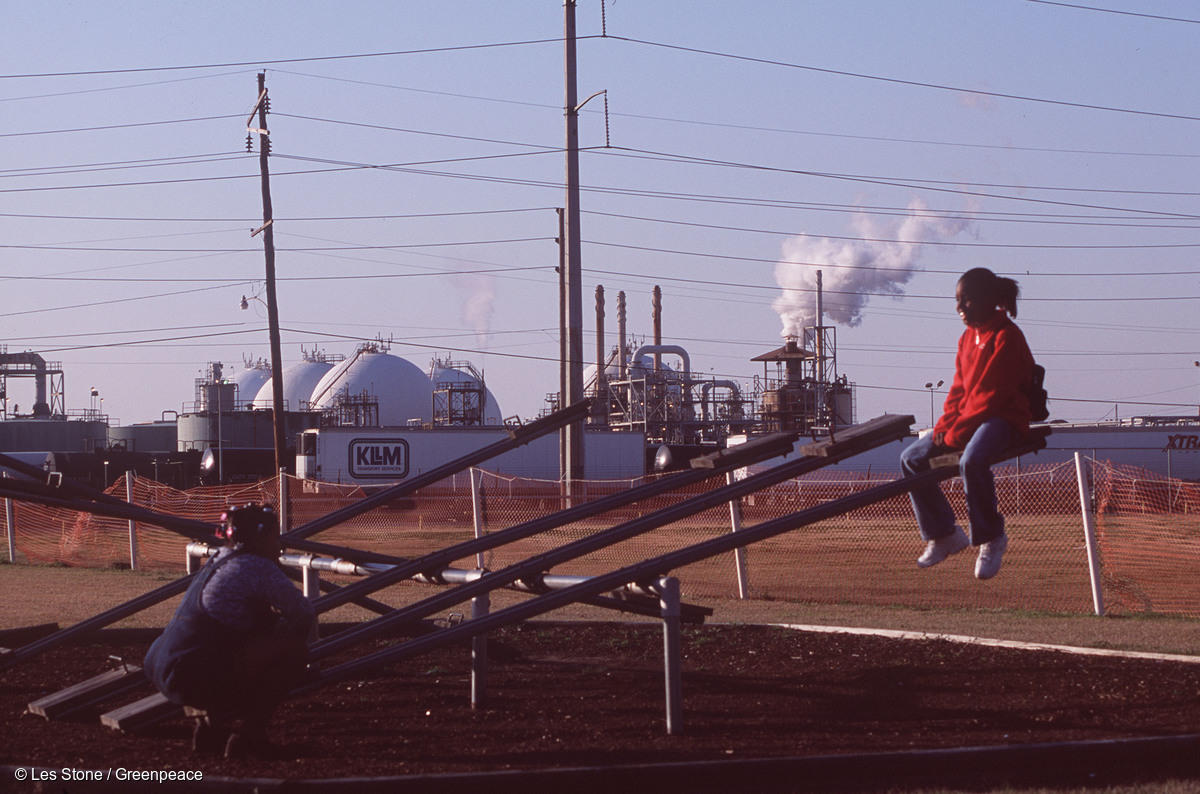
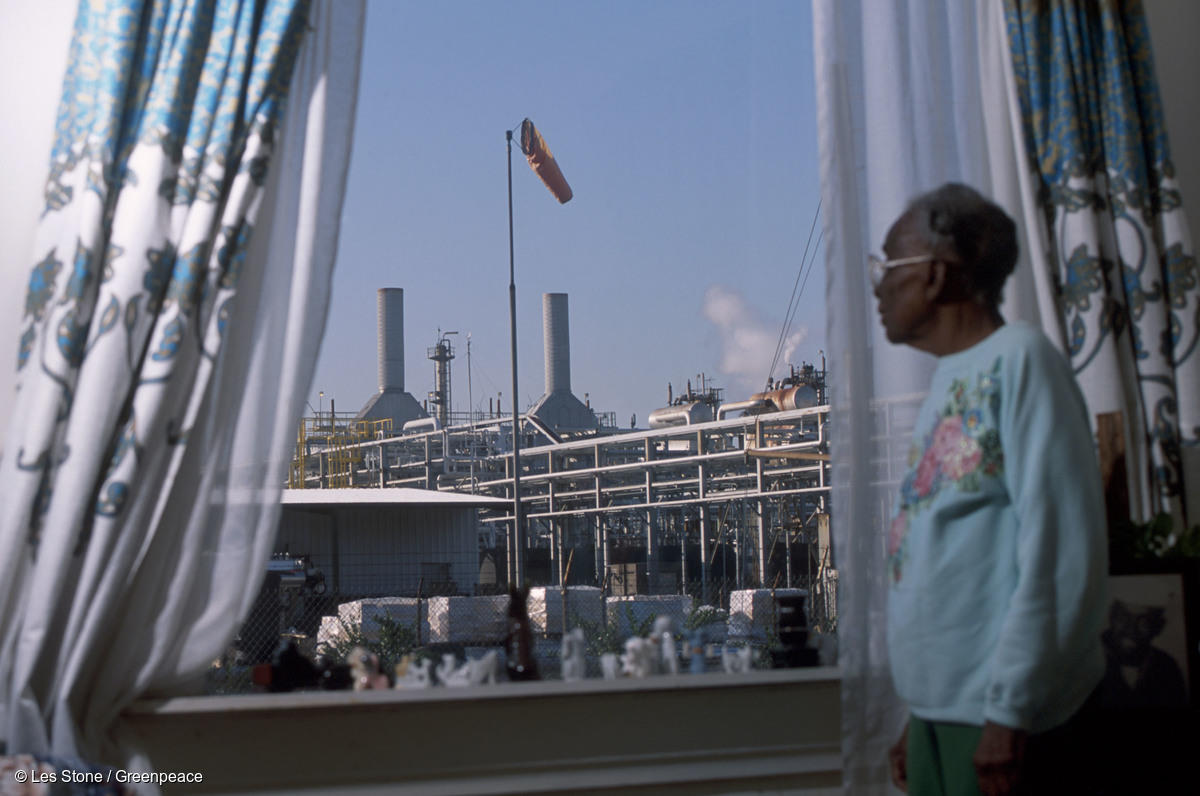
Each stage of the life cycles of oil, gas, and coal — extraction, processing, transport, and combustion — generates toxic air and water pollution, as well as greenhouse gas emissions that drive the global climate crisis. Exposure to fossil fuel pollution is linked to negative health impacts for people living near these pollution sources. The impacts of climate change are also strongly linked with rising health risks and threaten the ability of humans to live in various regions of the planet. The public health hazards from air and water pollution, and risks associated with climate change, fall disproportionately on Black, Latinx, Indigenous, Asian, and poor communities.
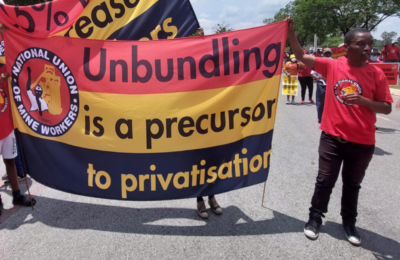
In addition to the accumulated negative impact on human health and the environment, fossil fuels depend on and contribute to the legacy of systemic racism in the United States. Oil, gas, and coal activity in the United States takes place on the ancestral lands of Indigenous peoples, making the fossil fuel industry complicit beneficiaries of the forced removal and genocide of Indigenous peoples. Racist practices such as redlining and housing discrimination, longstanding social and racial inequalities, colonization, Indigenous genocide and removal, and elected officials who are beholden to corporate power all combine to create a system in which the most dangerous impacts of pollution fall most heavily on the most disadvantaged, particularly Black, Brown, Indigenous, and poor communities.
More recently, the COVID-19 pandemic has exacerbated the disproportionate burden shouldered by these historically targeted communities across the United States, including by magnifying the health risks of air pollution from fossil fuels.
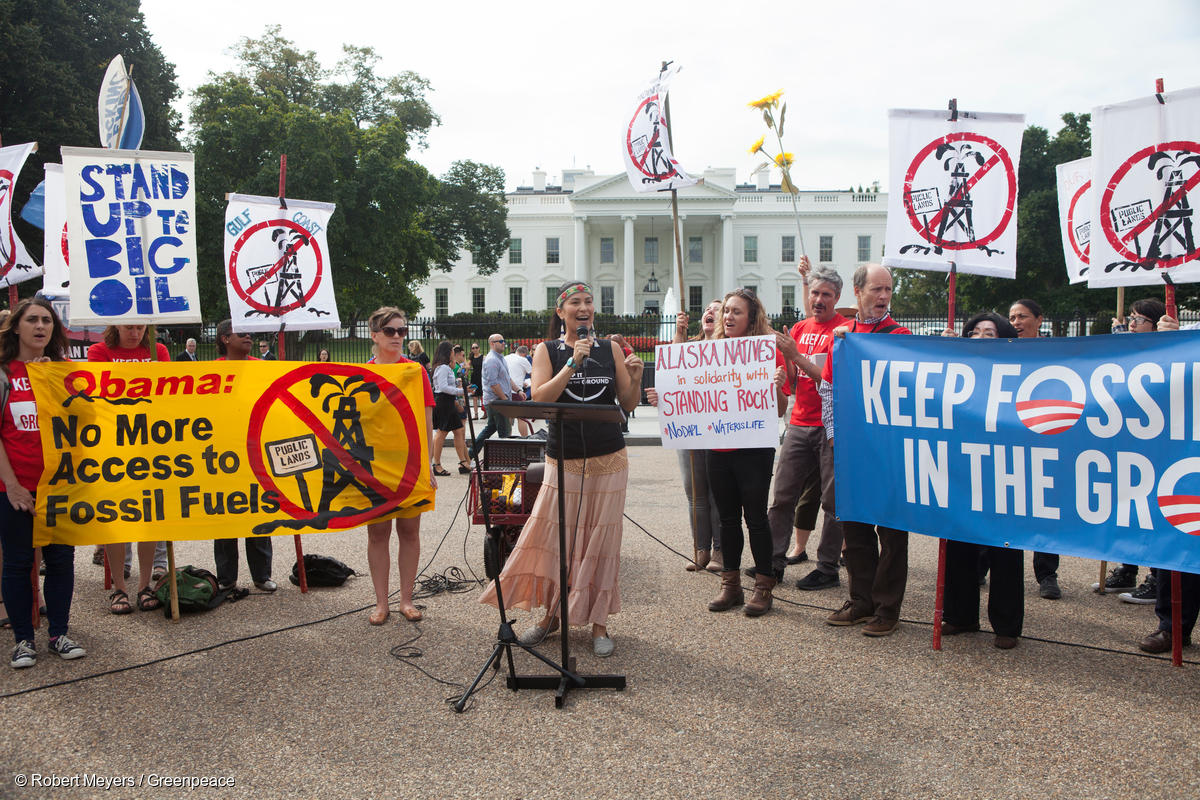
Tackling this fossil fuel racism would go a long way to address our present overlapping crises and correct the injustices that historically targeted communities have faced. A fossil fuel phaseout — an immediate halt to new extraction and infrastructure build-out and managed wind-down of existing production that prioritizes the needs of affected workers and communities — is necessary to end fossil fuel racism and fully address the public health, racial injustice, and climate crises.
Research shows that phasing out fossil fuels will deliver immediate public health improvements to historically targeted communities. Furthermore, any serious policy to address the climate crisis will inevitably require rapid reductions in fossil fuel consumption and production. But, policies that narrowly focus on carbon reductions without considering the full effects of greenhouse gas-emitting sources could fail to reduce local air and water pollution and end up perpetuating the racially inequitable impacts of the fossil fuel economy. Poorly designed climate policies could exacerbate pollution disparities and concentrate pollution in community “hotspots” even as overall carbon emissions decline. A fossil fuel phaseout would ensure air and water pollution as well as greenhouse gas emissions are reduced as part of a comprehensive response to the climate crisis.
President Joe Biden, the 117th Congress, and the nation have a mandate to transform our economy to repair past injustices and build a better future in which all communities can thrive. This decade will be crucial for putting our economy on a climate-safe trajectory, and the next year is a critical window for action to put us on the right track. President Biden can fulfill his promises to confront systemic racism, tackle the climate crisis, and Build Back Better by initiating a fossil fuel phaseout.
This report gives an overview of recent scientific studies and analyses of the harms due to fossil fuels and their disproportionate impact on Black, Brown, Indigenous, and poor communities in the United States. The report also contributes new analysis of the disproportionate impacts of toxic pollution from petroleum refineries and petrochemical facilities on Black, Brown, and poor communities. The report reviews impacts from each phase of the fossil fuel life cycle — extraction, processing, transport, combustion — and climate change impacts.
Key findings include:
Burning fossil fuels harms public health, disproportionately impacting Black, Brown, Indigenous, and poor communities:
- Harmful air pollution from the burning of fossil fuels (especially particulate matter and ground-level ozone) is a well-established health threat associated with respiratory and cardiovascular risks and premature mortality.[1]
- In 2018 in the United States, there were roughly 355,000 premature deaths due to fossil fuel-linked air pollution,[2] carrying an economic cost of hundreds of billions of dollars.
- People of color, especially Black/African-American people, and poor people are found to bear a disproportionately high burden of fossil fuel pollution across the United States. Black/African-American people have 1.54 times the exposure to particulate matter compared to the overall population.[3]
- Key sources for particulate pollution include coal-fired power plants[4] and vehicle transportation,[5] each of which disproportionately impacts Black, Brown, Indigenous, and poor communities.
Oil and gas extraction releases hazardous air pollutants that disproportionately burden Black, Brown, Indigenous, and poor communities:
- The extraction and processing of oil and gas is associated with emissions of a wide range of hazardous air pollutants, including carcinogens such as benzene and endocrine disruptors.[6]
- Nationally, 17.6 million people live within one mile of an active oil or gas well[7] — more than the populations of New York City, Los Angeles, Chicago, and Houston combined. More than 6.1 million people live within three miles of an oil and gas refinery.[8]
- Emerging scientific studies have linked exposure to oil and gas activity with negative health impacts including elevated cancer risk,[9] pregnancy complications, and respiratory and cardiovascular disease.[10]
- New analysis of the Environmental Protection Agency’s (EPA) Toxics Release Inventory finds that oil refineries and petrochemical facilities (which provide key inputs for plastics production) are among the worst polluting sectors of the economy, and that the toxic burden of those sectors falls disproportionately on Black, Brown, Indigenous, and poor communities.[11]
- Although findings vary by region, oil and gas extraction is also found to have disproportionate impacts on people of color, especially Black/African-American people.[12]
Phasing out fossil fuels would immediately improve public health, tackle the climate crisis, and address historical injustices.
- Many of the same communities dealing with the toxic legacy of fossil fuels are also on the front lines of rising climate impacts. Studies have shown that extreme heat in urban areas puts Black, Brown, Indigenous, and poor communities at disproportionate risk of premature deaths and birth complications.[13]
- Recent studies reveal a relationship between racist policies of the past, such as redlining and housing discrimination, and pollution and climate impacts such as extreme heat,[14] asthma,[15] and flooding.
- The COVID-19 pandemic has exacerbated the disproportionate impacts of fossil fuel pollution. Black/African-American and other people of color have been more likely to die from the disease. Preliminary science indicates that long-standing inequalities in exposure to air pollution could be an especially deadly risk factor for COVID19.
- Some studies show that restoration — undoing the public health harms of fossil fuel pollution — is possible. By taking advantage of “natural experiments” when refineries and power plants are retired, researchers have found measurable improvements in the health of nearby communities.
- Policies to address climate change by phasing out fossil fuels can have immediate local benefits to public health and lower the upfront costs of climate action.
Local and regional case studies of fossil fuel production in highly impacted areas shed greater light on the dangers to nearby communities:
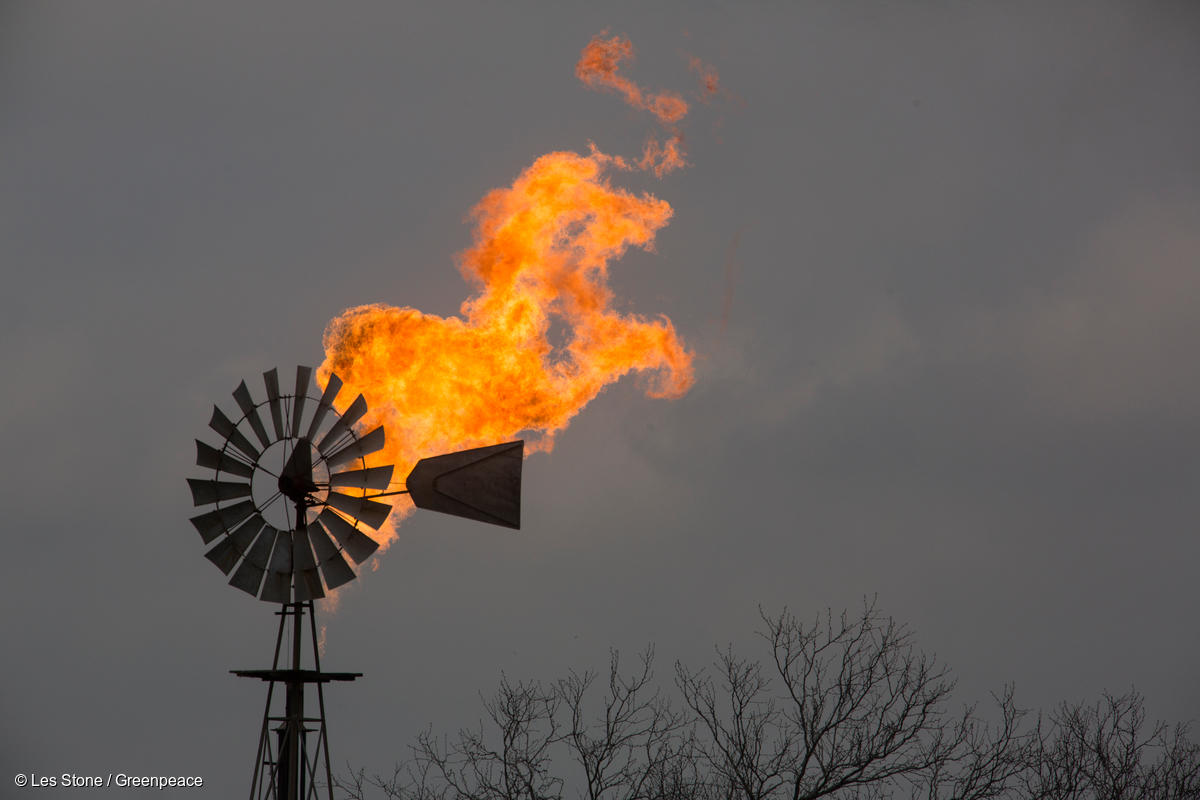
- In south Texas, fracking wastewater wells[16] and oil and gas flares[17] disproportionately harm Latinx communities. Latina women in the Eagle Ford shale — the site of a major fracking boom — face significantly higher risk of giving birth prematurely.[18]
- If completed, the proposed Formosa petrochemical plant in St. James, Louisiana, would likely double toxic air pollution (including carcinogenic benzene and ethylene oxide) in the region, which already bears the nickname “Cancer Alley” following decades of industrial pollution.
- Closing an oil refinery in the Toronto, Canada, suburb of Oakville eliminated 6,000 tons of sulfur dioxide pollution per year and helped reduce hospitalizations for respiratory illnesses in the area.[19]
- In Richmond, California — a predominantly Black and Latinx city in the San Francisco Bay Area — emergency room visits increased sevenfold after a major fire at Chevron’s Richmond Refinery in 2012.[20]
- After a series of coal and oil power plants were closed across California in the early 2000s, researchers found a significant decline in preterm births for women living in nearby communities.[21]
President Biden and Congress must confront the overlapping crises we face with a holistic approach to improve public health, tackle the climate crisis, and rectify our legacy of systemic racism by phasing out fossil fuel production. Our policy recommendations are rooted in Greenpeace USA’s Just Recovery Agenda and The Movement for Black Lives’ Red, Black, and Green New Deal platform. A full list of policy recommendations can be found in Chapter 8. In brief, to truly Build Back Better, President Biden and Congress must:
- End fossil fuel racism and reverse the legacies of historical injustices. Require air and water pollution reductions in environmental justice communities with a “No Hotspots” policy and policies to mitigate cumulative pollution impacts. Pass the Environmental Justice For All Act and Climate Equity Act, and institutionalize Free, Prior, and Informed Consent regarding federal actions affecting the lands, livelihoods, culture, and spirituality of Indigenous peoples.
- Phase out fossil fuel production. Pass the End Polluter Welfare Act to eliminate federal fossil fuel subsidies, halt new fossil fuel leases and permits on public lands and waters, and reject new federal fossil fuel infrastructure permits. Pass the Break Free from Plastic Pollution Act. Reinstate the crude oil export ban and prohibit exports of liquified natural gas and coal.
- Ensure no worker or community is left behind. Pass the Protecting the Right to Organize (PRO) Act to protect and expand the right of workers to organize. Mandate the use of project labor agreements, Davis-Bacon prevailing wage requirements, community benefit agreements, and high-road labor standards in any federally funded project. Create 250,00 high-quality job-years under a federal oil and gas well remediation program. Establish a federal Energy Worker and Community Protection Fund to guarantee wage, benefit, and pension protections for workers affected by the transition away from fossil fuels, replace lost tax and community revenue, and promote community revitalization and economic development.
- Enact a green and just economic recovery. Pass the THRIVE Act to invest at least $1 trillion per year for the next decade to create 15 million good jobs, cut climate pollution in half by 2030, ensure at least 50% of new investments directly benefit frontline and disadvantaged communities, ensure federal investments pass a rigorous environmental justice and equity screen to avoid exacerbating “pollution hotspots,” and uphold rigorous labor, climate, and equity standards.
- Protect and expand our democracy to make it work for all people. Pass the For the People Act (H.R.1 / S.1) and John Lewis Voting Rights Act (H.R. 4) to give more electoral power to the people and protect against racist voter suppression tactics. End the Jim Crow filibuster. Enact the BREATHE Act to protect communities from police brutality and racial injustice by investing in Black communities and re-imagining community safety.
Systemic racism and white supremacy have plagued the United States since colonization and have influenced the development of all aspects of society and law, including education, health, work, housing, policing, and more. Our energy systems are no different. The urgency of the interlocking crises we face today gives us an opening to build a better system based on science and justice.
Introduction
President Joe Biden and the 117th Congress are confronting multiple overlapping crises, which offer an opportunity and duty to significantly re-orient our economy to improve public health, repair past injustices, combat the climate crisis, and build a better future for all. According to the Intergovernmental Panel on Climate Change (IPCC), the world must cut its carbon dioxide emissions (CO2) in half this decade in order to have a chance at limiting warming to 1.5°C.[22] The COVID-19 pandemic and unprecedented economic crisis have thrust relief and recovery to the forefront of governmental agendas. The pandemic has further exposed the myriad ways in which the ongoing climate, public health, air pollution, housing, economic, and systemic racism crises intersect and bring harm to historically targeted Black, Brown, Indigenous, and poor communities.
Fossil fuels — oil, gas, and coal — lie at the center of these overlapping crises. Each stage of the life cycles of fossil fuels — extraction, processing, transport, and combustion — generates toxic air and water pollution, as well as greenhouse gas (GHG) emissions that drive the global climate crisis.[23] Decades of research have established that the air pollution and climate change impacts of fossil fuels harm public health and fall disproportionately on Black, Latinx, Indigenous, Asian, and other communities of color and poor communities.
Fossil fuel corporations also depend on and contribute to the legacy of systemic racism in the United States.[24] Racist practices such as redlining and housing discrimination, long-standing social and racial inequalities, colonization, Indigenous genocide and removal, and elected officials who are beholden to corporate power all combine to create a system where the most dangerous impacts of fossil fuel pollution fall most heavily on the most historically targeted communities.
This is fossil fuel racism in action.
Understanding the fossil fuel industry’s deep role in perpetuating racial injustice, public health harms, and the climate crisis is essential to advancing the most effective approach to mitigating the defining challenges of our time. Any comprehensive plan to address our present overlapping crises must include a fossil fuel phaseout: a swift halt to new extraction and a managed wind-down of existing production in a way that prioritizes the needs of workers and communities.
Effective action to combat the global climate crisis will necessarily require sharp reductions in fossil fuel production and consumption in the coming decades. Policies to mitigate climate change should not be judged solely by the metric of carbon emissions, but also by their reductions in air and water pollution and their restoration of communities harmed by decades of industrial pollution. A fossil fuel phaseout would help ensure that efforts to tackle the climate crisis also maximize public health benefits at all stages of our energy systems, and begin to rectify historical injustices.
This report provides a new comprehensive synthesis of the fossil fuel industry’s embedded contributions to our present crises, with a focus on the harmful and unequal impacts of deadly air pollution.
Chapter 1 opens with a brief overview of the environmental justice (EJ) movement — the beating heart of this nation’s struggle to correct a legacy of environmental racism. Chapter 2 lays out the primary air pollutants associated with fossil fuels and discusses the data and types of scientific analyses that investigate their prevalence and effects. Chapter 3 further discusses the concept of fossil fuel phaseout, and argues that this is a necessary approach to tackling the climate crisis and racial injustice in tandem.
In Chapters 4-7, we review recent scientific studies and analyses of the harms fossil fuels pose to public health, and their disproportionate impacts on Black, Brown, Indigenous, and poor communities in the United States. We also contribute new analysis of the disproportionate impacts of toxic pollution from petroleum refineries and petrochemical facilities on Black, Brown, and poor communities. These chapters are organized to review impacts at each stage of the fossil fuel lifecycle:
- Extraction, including oil and gas drilling and fracking, and coal mining;
- Processing & Transport, including oil refining, natural gas processing, petrochemical manufacturing, pipelines, and terminals;
- Combustion, including point sources such as power plants, industrial facilities, and mobile sources; and
- Climate Impacts, due specifically to greenhouse gas emissions associated with all parts of the fossil fuel lifecycle.
Finally, Chapter 8 provides detailed policy recommendations for President Joe Biden and the 117th Congress. To truly Build Back Better and address public health, systemic racism, and the climate crisis together, President Biden and Congress must:
- End fossil fuel racism and reverse the legacies of historical injustices.
- Phase out fossil fuel production.
- Ensure no worker or community is left behind.
- Enact a green and just economic recovery.
- Protect and expand our democracy to make it work for all people.
1. Environmental Justice
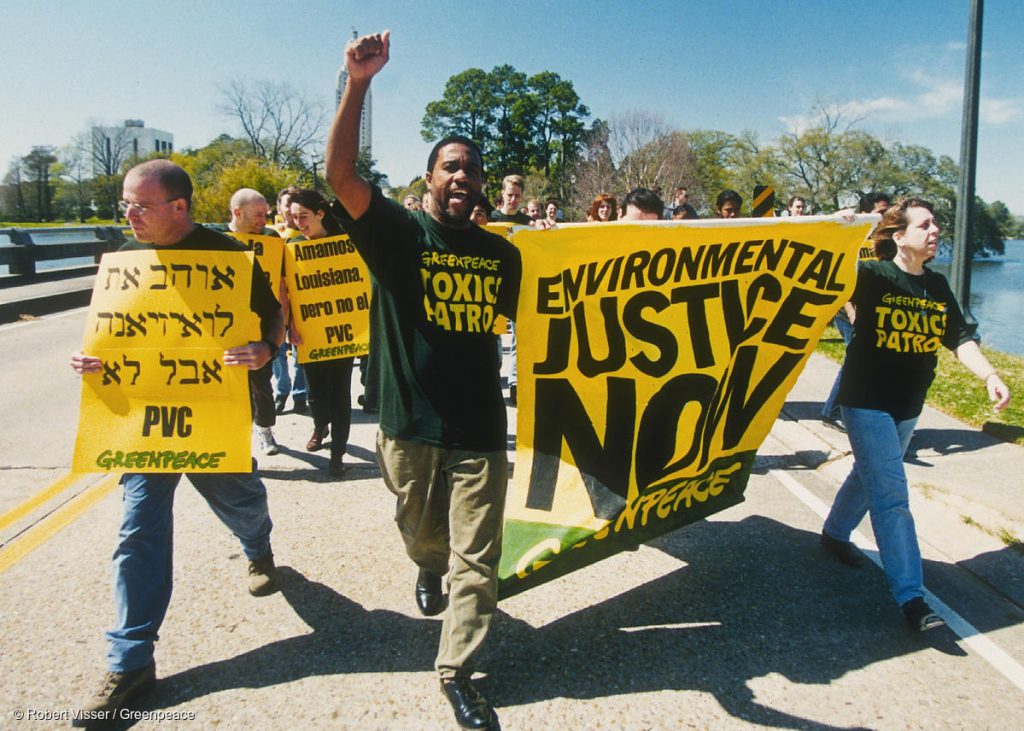
The unequal distribution of pollution has long been recognized by Black, Indigenous, Latinx, Asian, and other communities of color and poor communities across the United States, many of which organized to protect themselves and stop corporate dumping.[25] Community protests in 1982 opposing plans to create a landfill for PCB-contaminated soil in majority-Black Warren County, NC, are often cited as the birth of the Environmental Justice movement. A landmark 1987 study released by the United Church of Christ Commission for Racial Justice was the first to correlate hazardous waste sites with race.[26] Its publication brought the terms environmental racism and environmental justice (EJ) into the national conversation.
Today, after deep thought leadership from Dr. Robert Bullard, Dr. Beverly Wright, and other scholars, environmental justice is well established as a key framework for understanding environmental goals and policy.[27] Environmental Justice also comprises a social movement directly led by people living on the front lines of industrial activities who face the consequences of racism, consolidated corporate power, and pollution everyday.[28] These historically targeted communities are predominantly Black/African-American, Latinx, Indigenous, Asian, and/or poor. The Environmental Justice movement has forced national leaders and the public at large to place greater focus on the ways in which race and class intersect with our capitalist economy and political systems, and has challenged the structure, funding, and priorities of largely white-led environmental organizations.
During the 2020 campaign, combating environmental racism became a required component of many Democratic presidential candidates’ climate platforms. Joe Biden’s campaign pledged to make it a priority to “engage in community-driven approaches to develop solutions for environmental injustices affecting communities of color, low-income, and indigenous communities.”[29] Yet, despite the growing power of the Environmental Justice movement, local pollution risks remain a persistent problem and communities all across the United States and around the world are still fighting to end pollution in their neighborhoods.[30]
Sophisticated analyses of environmental racism have not always translated into concrete policy action, often because Environmental Justice communities are denied access to the political and economic power needed to rein in corporate polluters and enact people-first solutions. At the same time, policymakers often become beholden to corporate influence instead of the will of the voters who elect them. Indeed, gerrymandering and laws designed to suppress voter turnout systematically reduce the political influence of many of these communities.[31]
Fossil fuel corporations are key contributors to environmental injustice, as this report demonstrates, but Environmental Justice issues go beyond fossil fuels. Many early Environmental Justice fights and analyses were focused on incinerators, landfills, and hazardous waste sites. Industrial agriculture and heavy industries such as metal manufacturing have also been the focus of community action. More recently, the Flint, Michigan, water crisis has underscored the toxic legacy of lead in the environment, whether it is found in water pipes, contaminated soil, or paint in old buildings. The Environmental Justice concept extends as broadly as the definition of the environment itself, encompassing disparities in access to nature, access to housing and transit, noise and light pollution, and more.
Amidst these myriad Environmental Justice issues, fossil fuels remain a toxic presence in modern life. Our current intersecting crises arise out of a legacy of systemic racism from which fossil fuel corporations benefit and to which they contribute. The geography of housing and economic activity in the United States has been profoundly shaped by past practices of redlining (the practice, technically outlawed in 1968, of concentrating Black/African-American and other minority homeowners in certain areas by refusing housing loans)[32], housing discrimination, and job discrimination. The U.S. health system is also plagued by many of the same concerns about systemic racism and inequality.[33] Nationally, Black/African-American people are 40 percent more likely to have asthma and are almost three times more likely to die of “asthma-related causes” than the non-Hispanic white population.[34]
Oil, gas, and coal activity in the United States takes place on the ancestral lands of Indigenous peoples, making the fossil fuel industry complicit beneficiaries of the forced removal and genocide of Indigenous peoples. The first U.S. oil well, the Drake Well, was drilled in 1859 on ancestral Haudenosaunee (Iroquois) territory[35] near Titusville, Pennsylvania, by a company ironically named the Seneca Oil Company.[36]
By its nature, this summary is a reductive look at the public health impacts of fossil fuel-related air pollution and, by itself, does not deeply explore the ways in which these issues overlap and intersect with each other and other systems such as housing, employment, health care, immigration, and more. For example, the report does not fully explore ways in which the geography of fossil fuel extraction intersects with the history of colonization and Indigenous genocide and removal, including means by which those injustices have led to disparate impacts, harm to sacred places, and cultural and spiritual health harm.
Analyses to date have tended to take a piecemeal approach to examining the role of the coal, oil, and gas industries in perpetuating pollution, climate change, and environmental injustice. This report seeks to contribute to the literature by providing a comprehensive overview of the health impacts and disproportionate burdens of air pollution and climate impacts of fossil fuels at each stage of the coal, oil, and gas lifecycles.

There is robust evidence, across a wide variety of contexts and scales, that polluting industries impose health burdens on their neighbors and that these risks are generally higher for Black, Brown, Indigenous, and poor communities.[37],[38],[39],[40],[41] Many of these studies have examined cumulative or aggregate impacts; some studies have also summarized health and distributive justice information along fossil fuel supply chains.[42],[43],[44] This report synthesizes a wide range of recent scientific studies to paint an integrated picture of the fossil fuel industry’s role in modern society and its legacy of racial, environmental, and economic injustice.
This report is focused on the U.S. context, but many of the same issues arise across the globe.[45] Indeed, the history of the oil industry is closely intertwined with the history of colonialism, war, and global geopolitics.[46],[47],[48] Energy and industrial systems are global in nature, and as fossil fuel supply chains stretch across national borders, so too do the harms that result from that activity.[49] With the increasing focus on climate change, the concept of climate justice, along both global and generational axes, has also come to the forefront.
The COVID-19 pandemic has also exposed the stakes of inequality, as Black/African American people and other people of color have been more likely to die from the disease.[50] Although scientific studies have only begun to probe connections between oil and gas development, air pollution, systemic racism, and COVID-19, there are preliminary indications that the mix of factors could be especially deadly.[51],[52] One preliminary study found that even small increases in long-term air pollution exposure were associated with higher COVID-19 death rates.[53] As we discuss in detail in this report, Black, Brown, Indigenous, and poor communities have been exposed to higher levels of pollution for decades, in many cases reflecting historical discrimination and redlining.[54]
The Environmental Justice movement has elevated long-overlooked disparities and injustices to the forefront of a national reckoning with the legacy of creating “sacrifice zones” that trade the health of Black, Brown, Indigenous, and poor communities for corporate profits. We hope this report echoes and strengthens the demands from historically targeted communities to move beyond this sordid legacy and create a future in which all communities can thrive.

2. Fossil Fuels and Air Pollutants
Although we touch upon water pollution, land use, and other harms due to the fossil fuel industry, the bulk of this report focuses on air pollution.
The Clean Air Act draws a distinction between criteria air pollutants (widespread pollutants with regional impacts) and hazardous air pollutants (typically considered to be more local in their impacts). Above and beyond their greenhouse gas emissions fueling the climate crisis, fossil fuel production and use generates both criteria and hazardous air pollutants.
There are six criteria air pollutants[55] regulated under the National Ambient Air Quality Standards (NAAQS):
- Particulate matter, subdivided into PM5 (fine particulates) and PM10, and sometimes commonly referred to as “soot.” Particulates can be generated by combustion and from other sources such as unpaved roads and agricultural fields. PM can also be formed from precursor pollutants such as nitrogen oxide (NOx) and sulfur dioxide (SO2).[56]
- Nitrogen dioxide (NO2) is commonly grouped with other nitrogen oxides and termed NOx. Nitrogen dioxide is primarily generated by combustion of fossil fuels.[57]
- Sulfur dioxide (SO2) is also primarily generated by combustion of fossil fuels.[58]
- Ground-level ozone (O3) is distinguished from stratospheric ozone, which makes up Earth’s “ozone layer.” Ground-level ozone is not directly emitted to the atmosphere, but is formed by chemical reactions between NOx and volatile organic compounds (VOCs) in the presence of heat and sunlight.[59] Because ozone formation is affected by temperature, evidence suggests that climate change will itself impose a “climate penalty” and lead to higher ozone levels.[60]
- Carbon monoxide (CO) is formed when something is burned, and the largest source of outdoor CO is fossil fuel combustion.[61]
- Lead (Pb) air emissions were successfully reduced by 98% from 1980 to 2014 thanks to U.S. Environmental Protection Agency (EPA) regulations that eliminated lead in gasoline.[62]
All of these criteria pollutants are potentially generated as a consequence of the combustion of fossil fuels, with PM2.5, ozone, and NOx being of particular concern. Because criteria pollutants are associated with mobile sources and a wide range of stationary sources, their pollution is generally more widespread and can degrade regional and national air quality.
The Clean Air Act also regulates hazardous air pollutants (also known as “air toxics” or HAPs), of which there are 187 substances under scrutiny, from a wide range of sources including fossil fuels.[63] These pollutants are often associated with specific facilities, and are regulated differently than the criteria pollutants. Oil and gas produced at the well can contain varying mixtures of many of these substances, and fluids used during the fracking process can introduce numerous other chemicals. Researchers have documented 61 hazardous air pollutants detected near drilling operations.[64] HAP emissions can arise from drilling activities, leaks from infrastructure, during refining and processing, and from end-use combustion.
Notable air toxics that we touch on in this report include:
- The BTEX chemicals (benzene, toluene, ethylbenzene, and xylene) are naturally occurring substances found in oil and gas deposits, and are present in gasoline and other refined petroleum products. Benzene in particular is a carcinogen, and exposure to these substances can have both acute and chronic health effects.
- Many components of oil and gas mixtures are grouped under the term volatile organic compounds (VOCs). These can include the BTEX chemicals, formaldehyde, ethane, propane,[65] butane, pentane, hexane, and many others.[66] These VOCs are also a key ingredient in the formation of ground-level ozone. Another related class are termed polycyclic aromatic hydrocarbons (PAHs), which are also associated with fossil fuels.
- Hydrogen sulfide (H2S) is a highly toxic and dangerous gas that occurs naturally in oil and gas deposits. It has long been recognized as a serious hazard for workers and communities living near oil and gas infrastructure.[67] Oil and gas with high sulfur concentrations are termed “sour” while lower concentrations are called “sweet.”
- Heavy metals such as mercury, chromium, cadmium, lead and others are byproducts of coal and oil combustion. For example, emissions of inorganic mercury from coal plants can be converted into highly toxic methylmercury by aquatic microbes, which can then bioaccumulate in fish and lead to human exposure.
The EPA maintains the Toxics Release Inventory (TRI), which tracks many types of emissions by facility.[68] Using this national dataset, the EPA has also developed a risk screening tool, the Risk-Screening Environmental Indicators (RSEI), which combines emissions, toxicity, and impacted population into a single toxic score for each reporting facility.[69] Periodically, the EPA undertakes its National Air Toxics Assessment (NATA), which aims to estimate health risks from air toxics emissions.[70] The EPA also maintains EJScreen, a tool to map and assess EJ indicators.[71]
Types of Studies
Health effects studies vary significantly by study design, which can provide different information about a potential health hazard and have different limitations on what conclusions can be drawn from them.[72] Studies also vary by geographic scale (from individual facilities to regional to national-scale) and time scale (from single events to cumulative exposure over years). Different pollutants can be associated with a range of different health endpoints, from respiratory issues to birth complications to cancer. Human exposure to a hazard can vary by population patterns, weather patterns, regulation, enforcement, variation among facilities,[73] and other factors.
The EPA uses a risk assessment paradigm to synthesize these various types of scientific information in a manner that can inform policy making. Key stages of this process involve hazard identification, assessing dose-response, assessing exposure, and characterizing the risk.[74]
This chain of causation is most fully developed for some of the widespread criteria air pollutants — notably, PM2.5 and ozone. Through its scientific review processes, the EPA has developed full scientific assessments for those pollutants and used them to set national standards and assess the health impacts of its rulemakings under the Clean Air Act.[75] The picture is more uncertain for many of the numerous air toxics of concern. Challenges to a full risk assessment for HAPs include: uncertainties in emissions inventories and background levels, lack of air monitoring data, small sample sizes, lack of dose-response data, difficulty extrapolating to low doses, difficulty in tracking long-term health impacts (such as cancer), and other factors.[76]
Overlaying demographic patterns to assess disproportionate impact adds yet more complexity. Studies of disproportionate impact can also vary by geographic scale, and comparing across states can run up against data limitations, as well as regional differences in human geography.
Traditional distributive justice analyses look at patterns of how environmental risks are distributed among populations, while benefits sharing studies analyze how profits or other economic benefits related to polluting industries are shared among stakeholders.[77] Procedural justice analyses look at the fairness and inclusiveness of policy and decision-making. Other studies have looked to investigate the dynamics of why these patterns exist, to better understand solutions.[78]
Complicating all of this is that the scientific process itself has become a target for political interference over recent decades. Polluting industries have taken a page from the tobacco industry and have sought to protect their products and investments from liability, regulation, and public outrage by “manufacturing doubt” about environmental and health threats.[79] The “capture” of regulatory agencies has also led to significant political interference in the work of government scientists, who might otherwise be expected to work in the general public interest.[80] Under the Trump administration, air pollution science at the EPA became a particular target for political interference.[81] The Biden administration must prioritize both rolling back harmful policies and rebuilding agencies’ scientific capacity.
3. Fossil Fuel Phaseout
Limiting global warming to the 1.5°C goal to which nations agreed to strive in the Paris Agreement will require cutting carbon dioxide emissions in half in the next decade and reaching net-zero GHG emissions globally by 2050.[82] For scenarios that do not rely on unproven levels of carbon capture or carbon removal, these goals will inevitably require rapid reductions in fossil fuel consumption and production.[83]
Unfortunately, fossil fuel reserves that are already under development contain enough carbon to push us past the 1.5°C carbon budget and exhaust the 2°C budget.[84] For this and other reasons, any comprehensive climate policy platform must focus not just on building out renewable solutions, but also on policies to phase out fossil fuel production[85] and prevent new investments that lock in future fossil fuel pollution.[86] A “managed decline” of the fossil fuel industry[87] could also facilitate plans and programs to ensure that all workers and communities are left better off through the transition.
A mountain of public health research has convincingly linked air pollution exposure to adverse human health impacts, and has identified air pollution as among the most significant health burdens, both globally[88],[89] and in the United States.[90],[91] Exposure to air pollution has been linked to higher incidences of heart disease, strokes, asthma, chronic obstructive pulmonary disease, lung cancer, diabetes, and more. Vulnerable populations include the elderly, children,[92] and people with underlying health conditions. The most significant sources of air pollution are the combustion of fossil fuels (and biomass),[93] and as a result, policies to address climate change and phase out fossil fuels are also shown to have significant health co-benefits due to reduced air pollution.[94],[95],[96] These co-benefits are both immediate and local, and can offset climate mitigation costs.[97],[98],[99]
For these reasons, strong policies to limit warming to 1.5°C also hold the potential to provide immediate local health benefits to communities that have long battled environmental racism. But these benefits will only be maximized if policymakers explicitly mitigate air and water pollution, advance environmental justice, and meaningfully include historically targeted communities in climate policy-making and implementation.
Environmental justice groups have long voiced skepticism about “carbon-only” and market-focused climate policies.[100],[101] Climate policy approaches such as cap-and-trade or carbon taxes have little evidence of achieving the scale of CO2 emissions reductions needed on their own, and in some cases market-based carbon reduction mechanisms have actually increased local CO2 emissions and other toxic air pollutants in pollution “hotspots” (i.e., localized areas with elevated pollution levels).” Climate policy-making questions about the scale of pollution co-benefits (“have we maximized public health gains as we reduce carbon emissions?”) and their distribution (“have we reduced long-standing pollution disparities, or do hotspots remain even as overall pollution levels decline?”) are important to address. “Carbon-only” approaches may miss an opportunity to maximize public health and distributive justice benefits — or even exacerbate existing pollution impacts and inequities.

One recent study investigated the impact of California’s cap-and-trade system and found that in the early years of the program, “Neighborhoods that experienced increases in annual average GHG and co-pollutant emissions from regulated facilities nearby after trading began had higher proportions of people of color and poor, less educated, and linguistically isolated residents, compared to neighborhoods that experienced decreases in GHGs.”[102] There are many open questions about the ultimate effects of California’s system, but these initial results illustrate some of the risks to EJ communities.[103]
Another recent study compared pathways to reduce emissions in the power sector and found that a “carbon-only” policy risks increasing relative pollution disparities, and in some cases, absolute pollution levels in EJ communities.[104] This is because under certain conditions, a “carbon-only” policy favors switching from coal to natural gas-fired power, instead of driving a build-out of renewables. By contrast, a policy to pair CO2 reduction goals with air pollution and environmental justice goals can achieve greater overall pollution co-benefits with only minimal cost increases.
Similarly, climate action plans that rely on offsets, natural gas fuel switching, or a massive build-out of carbon capture and sequestration (CCS) infrastructure also run the risk of aggravating local air and water pollution impacts and propping up a racist, fossil-fuel powered energy system. Even as CO2 emissions are “offset” or “captured,” these technologies and policies can allow local CO2 emissions or other pollution to continue, perpetuating harmful health impacts for communities. The United States currently subsidizes the use of captured CO2 to extract oil from depleted fields, a process known as enhanced oil recovery (EOR). Oil companies are now using EOR and offsets to market “carbon neutral oil.”[105] However, such oil will still contribute to air and water pollution as it is extracted and burned — with similar health and justice concerns.
CCS technology captures CO2 but does not capture other air pollutants from combustion sites, and increased energy requirements of the process itself can lead to greater overall fuel use and increased emissions for some air pollutants.[106] If no additional air pollution control investments are made, widespread adoption of CCS could lead to increases in air pollution related mortality and higher social costs.[107]
California’s reliance on carbon offsets as a component of its cap-and-trade system has also drawn opposition from EJ advocates, including the recent resignation of two advisory board members to protest an expansion of the program.[108] Carbon offsets allow in-state facilities to continue emitting and pay to finance projects that purport to reduce emissions elsewhere. Such offsets do nothing to reduce local co-pollutants, and have been plagued by questions about effectiveness and verification of emissions reductions.[109]
Many of the proposed technology-neutral, “carbon-only” plans are explicitly framed as a way of maintaining fossil fuel jobs.[110] This is a misleading frame and will likely have the consequence of allowing a dangerous industry to continue polluting for longer, while delaying and denying justice for polluted communities and fossil fuel workers themselves. There is no doubt that workers and fossil-fuel dependent communities will need support during the energy transition. The Green New Deal has sparked a reorientation of climate policy thinking around a “standards, investments, and justice” framework that opens space to ensure that both fossil fuel workers and polluted communities can get justice.[111]
Fossil fuel corporations have not acted in good faith on climate change nor air pollution, and their stance has been to maintain their economic position for as long as possible while deploying messaging tactics that greenwash their business model. Fossil fuel corporations have known about the scale of the climate threat for decades,[112] but instead of warning the public, their public communications tended to downplay climate risks[113] and they spent millions on a campaign to sow doubt and misinformation.[114] Just as fossil fuel companies were shown to have known about the realities of climate change as far back as the 1960s and ‘70s, so too did they know about the human health impacts of air pollution during that time. And, as with climate change, the industry responded with denial and delay in the decades that followed, and sought to block or undermine air quality regulations.[115]
In short, “carbon-only” approaches to mitigating climate change that do not explicitly integrate air and water pollution and environmental justice considerations could fail to alleviate the public health harms and disproportionate burdens of fossil fuel production and use — or even exacerbate them. Instead, holistic approaches are necessary. One ingredient of a holistic climate policy approach could be to include rigorous environmental justice and equity screens in all carbon emission mitigation measures.
Another, perhaps more direct and effective approach, is to pursue a managed phaseout of fossil fuels. A fossil fuel phaseout ensures that the transition away from toxic energy sources is as complete and rapid as possible, neither delaying the necessary transition nor leaving behind pockets of pollution. A fossil fuel phaseout also allows policymakers to plan for the transition needs of workers and communities, rather than leaving it up to unpredictable, market-driven forces.
The next four sections detail the public health harms and disproportionate impacts of fossil fuels at each stage of their supply chain.

4. Extraction
Harm to people and the environment from fossil fuels begins with extraction. Oil and gas deposits contain toxic chemicals, and the processes of drilling, development, and production can lead to human exposure to both hazardous and criteria air pollutants. Coal mining, too, is associated with significant health risks for both workers and nearby communities.
Oil and Gas Extraction
Over the past decade, the shale boom has brought increased scrutiny on oil and gas production in the United States, with a particular focus on air and water pollution related to hydraulic fracturing (“fracking”) and other drilling techniques. Although fracking itself is only a specific part of the drilling process for certain wells, the term has become a synecdoche for the entire industry and its negative consequences for health and the environment.
Nationally, 17.6 million people live within one mile of at least one active oil and gas well.[116] Shale now accounts for 65% of oil production and 78% of gas production in the United States, although a significant portion of U.S. production still comes from conventional wells.[117] Tar sands extraction in Alberta has also been a big topic in the United States due to the build-out of pipelines to transport oil south to the Gulf Coast. Many of the health risks discussed below are applicable to conventional and unconventional production because exposure can occur not just at the wellhead or due to a particular well-stimulation event, but at other times and locations as well.
Public Health Harm
A large volume of studies have investigated the impacts of unconventional oil and gas extraction. Groups such as PSE Healthy Energy,[118],[119] Concerned Health Professionals of New York (CHPNY) and Physicians for Social Responsibility (PSR),[120] and other researchers[121],[122],[123] have published comprehensive reviews of the literature. In this section, we focus primarily on the air pollution risks of fracking,[124] but studies have also detailed risks from water pollution (due to spills, waste discharge, and underground migration of chemicals), earthquakes, naturally occurring radioactive substances, lost ecosystem services,[125] noise pollution, and a variety of economic impacts.[126]
Natural gas is primarily composed of methane (CH4), which is a greenhouse gas with a warming potential 84-87 times greater than CO2 over a twenty-year timeframe.[127] One key axis of the fracking debate, which we don’t discuss here, has revolved around the climate impacts of methane emissions (either vented or fugitive) and the size of any climate “benefit” relative to coal.[128] However, methane is also a potential ozone precursor and can therefore play a role in increasing ozone concentration in regions with high levels of drilling.[129],[130]
In addition to methane, over 60 hazardous air pollutants have been detected near oil and gas extraction sites,[131] including carcinogens, volatile organic compounds (VOCs), endocrine disrupting chemicals,[132] and more. VOC emissions from fracking can lead to ground-level ozone formation and contribute to regional air pollution. In addition to direct emissions, widespread gas flaring in drilling regions[133] and the presence of related infrastructure, such as compressor stations and increased truck traffic, can lead to particulate matter and NOx pollution.[134] Monitoring studies near drilling sites have begun to estimate human exposure levels to various pollutants as a function of distance, although they note that exposure can vary significantly over time.[135],[136],[137]
Three oil and gas basins — the Permian (located in Texas and New Mexico), Eagle Ford (Texas), and Bakken (North Dakota and Montana) — account for 83% of gas flaring activity in the United States. Half a million people living in those basins reside within three miles (five kilometers) of a flare, with 39% living close to more than 100 flares.[138]
A forthcoming study quantified the health impact of oil and gas production due to criteria pollutants alone, and found that in 2016 the sector’s emissions resulted in 7,500 excess deaths, along with other health impacts.[139] A variety of studies have associated proximity to oil and gas activity with health problems such as respiratory impacts (e.g., asthma), cancer, poor birth outcomes, cardiovascular impacts, sleep disturbance, and mental health issues. Although not a comprehensive review, the following paragraphs provide a selection of recent health findings.
An emerging body of evidence associates close proximity to oil and gas activity with elevated cancer risk, although researchers note further study is warranted.[140],[141],[142] Most notably, a study in Colorado’s oil and gas region used in situ monitoring of benzene and other HAPs and found that within 500 feet of oil and gas well sites, cancer risk was eight times higher than EPA’s level of concern.[143] This and earlier studies found that both cancer and non-cancer health risks were greatest within one-half mile of wells, with benzene exposure being the largest risk factor.[144]
In recent years, studies have strengthened the association between oil and gas development and adverse birth outcomes. A study in California’s San Joaquin Valley found that “exposure to oil and gas well sites is associated with increased risk of spontaneous preterm birth.”[145] Another California-based study found proximity to higher oil and gas development ”was associated with adverse birth outcomes among mothers residing in rural areas.”[146] A study set in the Eagle Ford region of Texas found evidence that exposure to flaring is “associated with an increased risk of preterm birth.”[147] Other studies have found similar results in Colorado,[148] Pennsylvania,[149] and Oklahoma.[150]
Oil and gas development is a source of ozone precursors (notably VOCs and NOx) and has been associated with elevated regional ozone levels.[151],[152] Elevated ozone levels are in turn associated with asthma exacerbation.[153] Some recent studies have observed associations between oil and gas activity and asthma diagnoses, emergency room visits, and hospitalizations.[154],[155],[156] Studies have also found associations between oil and gas activity and cardiovascular disease.[157],[158]
A recent study in Oklahoma found that an increase in the number of oil and gas wells are associated with increases in “mortality rates, and incidences of cancer, cardiac, and respiratory diseases in communities in close spatial proximity” and decreases in life expectancy.[159] The authors of the most recent CHPNY and PSR compendium of scientific studies concluded, “Our examination uncovered no evidence that fracking can be practiced in a manner that does not threaten human health directly and without imperiling climate stability upon which public health depends.”[160]

Disproportionate Impact
Unlike industrial facilities, which are sited according to economic, political, and social factors, oil and gas extraction takes place in areas with specific geologic characteristics, although other factors can play a role in how extraction occurs. These drilling areas can vary widely in their demographics and environmental justice impacts, but emerging evidence shows that in general, “pregnant women, children, communities of color, Indigenous people, and impoverished communities are disproportionately harmed by fracking.”[161]
Studies of the distributive environmental justice of fracking show that impacted populations can vary by geography.[162][163] In south Texas, there is evidence that fracking wastewater disposal wells are disproportionately located in Black, Brown, Indigenous, and poor communities.[164],[165] Similarly, south Texas oil and gas flaring is found to disproportionately occur in Hispanic communities,[166] and the risk of birth complications is higher among Hispanic women.[167] Flaring in the Bakken is found to disproportionately impact the Fort Berthold Indian Reservation in particular, while in the Permian and Eagle Ford basins, a majority of the population living near flaring are people of color.[168]
On the other hand, studies of the location of fracking wells in the Marcellus shale region of Pennsylvania, Ohio, and West Virginia found more mixed evidence on distributive environmental justice metrics. One study found no evidence of racial or income disparities,[169] while another found evidence for income disparities only in Pennsylvania.[170] Notably, the region is largely white with relatively high poverty levels.
In California, people living close to oil and gas wells are disproportionately from low-income households with non-white and Latinx demographics.[171],[172] Concerns about drilling and vulnerable populations are found in both rural Kern County[173] and urban Los Angeles.[174] Notably, the history of redlining and oil drilling in Los Angeles stretches back to the earliest days of the oil industry. In the 1930s, the location of oil development and resources were factors used in defining redlined areas.[175]
A more recent study combining data from four states found “robust evidence that minorities, especially African Americans, disproportionately live near fracking wells, but less consistent evidence for environmental injustice by income or educational attainment.”[176] The study noted significant variation from state to state, including disparities impacting Black/African-American people in Oklahoma and Texas, and Hispanic people in Texas and urban Colorado, but no racial disparities in Pennsylvania.
Other studies have analyzed the problem from benefit sharing and procedural justice perspectives. One study of Denton, Texas, found that the town’s residents (who must deal with pollution risks from drilling) only own 1% of the total mineral wealth value, and the largest share of the town’s mineral rights owners live outside of Texas. Denton residents receive some indirect benefits from extraction through taxes and other revenue that is collected by the city.[177] Another study looked at property values near oil and gas wells in Colorado and described complex dynamics in how populations respond to oil and gas development. The authors observed “economic, rural, participatory, and/or distributive injustices that could contribute to health risk vulnerabilities in populations near O&G [oil and gas] wells.”[178]
Indigenous communities have long faced high levels of violence, which are being further exacerbated by extractive industries. In recent years, the United States and Canada have seen an epidemic of murdered and missing Indigenous women (MMIW) at a rate “10 times higher than other ethnicities,” and which represents the third-leading cause of death for Indigenous women in the United States.[179] Indigenous communities have identified industrial camps, sometimes called “man-camps,” associated with large resource development projects (such as pipelines) as a contributor to violence.[180] A recent U.S.-based study analyzed 23 MMIW “hotspots” and found fracking operations as a “likely contributing factor” in many of them.[181]
Coal Mining
Public Health Harm
Coal mining in the United States has changed dramatically in recent decades, even as the industry is in structural decline. Industry focus has shifted from Appalachia to Western states, and from underground mining to surface mining (including mountaintop removal mining, or MTR). Coal mining has long generated significant health and safety risks for its workers, and for nearby coal communities. Strong transition policies will be needed to ensure all impacted workers and communities are made better during the transition away from coal.
Coal mining has long been a dangerous profession, and tragic accidents still occur from gas leaks, explosions, cave-ins, and more. Since 1900, over 100,000 miners have been killed in the United States. Black lung disease (pneumoconiosis) has also made a return among Appalachian coal miners.[182] Mine safety regulations seemed to put the disease on a path to eradication in the 1990s, but the trend reversed after 2000 and now as many as one in five miners in Central Appalachia shows evidence of black lung.[183]
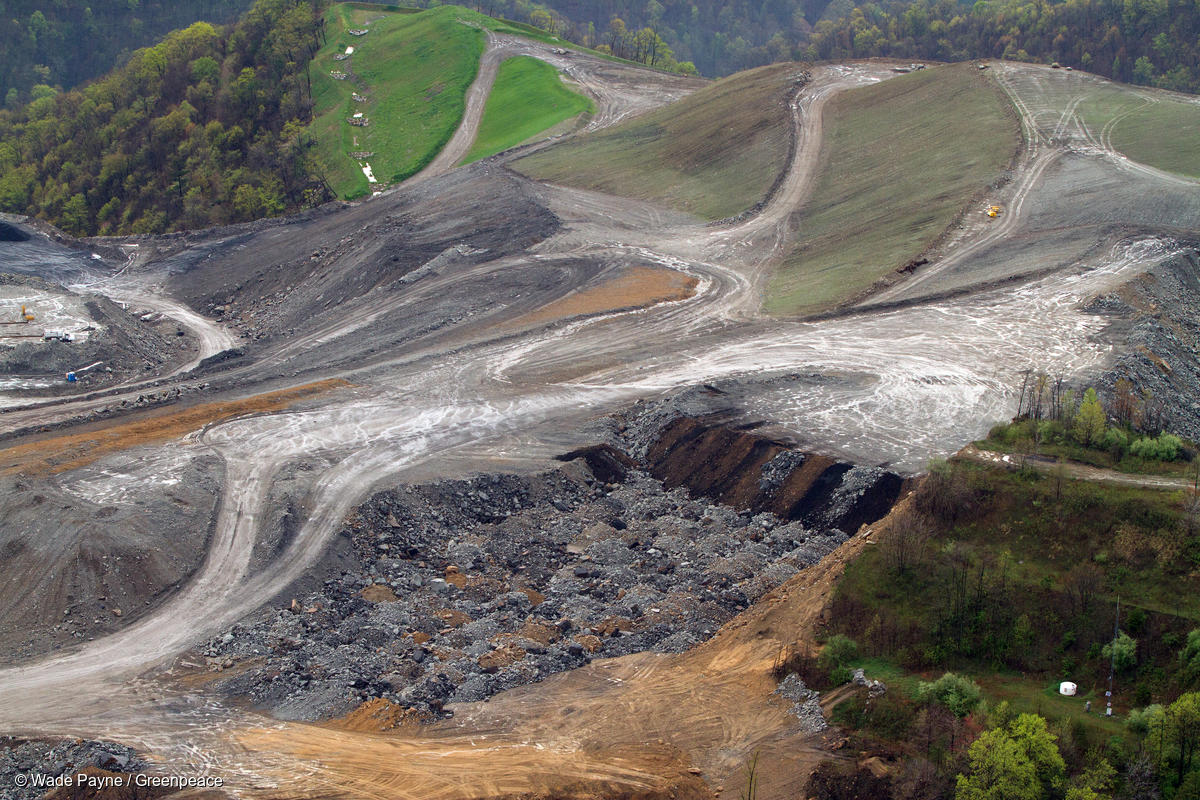
Mining creates significant health risks for local communities as well. MTR mining radically alters the landscape, removing mountain ridges and vegetation, and filling valleys with mining “spoil.” This process can increase the risks of mudslides and floods, contaminate drinking water, and increase air and noise pollution. Impoundments of coal slurry also create local health hazards due to improper storage, and can lead to significant spills.
A series of health studies in Appalachia found associations between mining intensity and mortality, lung cancer, poor birth outcomes, and other diseases. The excess mortality rate in the region was estimated to be over 2,300 deaths every year.[184]
Disproportionate Impact
The Appalachian coal-mining region is majority white (although with a long Black/African-American heritage[185]), and has long seen elevated poverty levels and a high proportion of economically distressed counties.[186] Some studies have found that MTR regions have “significantly higher mortality rates, total poverty rates, and child poverty rates” compared to other comparable counties.[187] Other studies have noted that the impact of coal employment on poverty and well-being has been mixed and has changed over time.[188]
The largest coal-producing region in the United States is now the Powder River Basin in Montana and Wyoming, where 16 mines produce 43% of U.S. coal.[189] The region is sparsely populated, and the population is roughly 85% White and 11% Native American.[190] The Basin overlaps with both the Crow Reservation and the Northern Cheyenne Reservation. Decisions in the 1970s to open up the region to coal production led the Crow and Northern Cheyenne Nations to revolt against federal management of Tribal resources and demand greater control over development of their energy resources.[191] Since that time, the Crow and the Northern Cheyenne Nations have pursued different strategies to manage energy extraction on their lands.[192]
5. Processing & Transport
Oil, gas, and coal extraction occurs in specific, although widespread, geographic areas. Extensive networks of pipelines, terminals, storage facilities, tankers, trains, and trucks are needed to transport fuels either to their end markets, or to processing hubs where they are transformed into commercial products. Risks of human exposure to hazardous or criteria air pollutants can occur all along these networks, but certain regions have particularly high concentrations of emitters.
Oil Refining, Natural Gas Processing & Petrochemical Manufacturing
After extraction, crude oil is processed in oil refineries to create a variety of petroleum products, including gasoline, diesel, jet fuel, heavy fuel oil, and others. Natural gas from the wellhead is processed to separate out dry gas (used for power and heating) from natural gas liquids (NGLs), which are common inputs in petrochemical manufacturing, including plastics production.
Public Health Harm
Refineries, natural gas processing, and petrochemical facilities are associated with both criteria and hazardous air emissions, which impose health risks on nearby communities.[193],[194] The Toxic Release Inventory (TRI) tracks the emissions of toxic air and water releases from some of these facilities, although not all industries are covered. Because TRI tracks such a wide diversity of toxic emissions, the EPA has developed Risk-Screening Environmental Indicators (RSEI) to synthesize TRI data into simpler indicators of the overall toxic burden from a facility. RSEI data combines overall emissions with the toxicity of each pollutant and the size of the exposed population.[195]
A 2009 study using RSEI data found that the petroleum refining sector was the 9th most polluting economic sector among industries reporting to TRI.[196],[197] New Greenpeace analysis of the 2018 RSEI data shows that petroleum refineries and petrochemical manufacturing remain the #8 and #9 most polluting industries, representing 2.7% and 2.6%, respectively, of the total national toxic burden reported to TRI.[198] The only sectors with greater toxic risks are certain types of chemical and metal manufacturing. One recent study noted that 6.1 million Americans live within three miles of a refinery.[199]
A number of studies have investigated health impacts associated with specific refineries or petrochemical facilities,[200],[201],[202] although individuals sites will naturally vary with respect to local populations, pollutants, emissions levels, regulation, enforcement, etc. Meta-analyses have also uncovered evidence associating refineries and petrochemical facilities with both cancer[203],[204] and non-cancer health risks.[205],[206] One notable study is a “natural experiment” regarding a refinery closure in Oakville, Ontario, which found that a reduction in SO2 emissions led to measurable improvements in local health.[207]
Other studies have looked at the impact of higher emissions levels resulting from breakdowns, accidents, explosions, spills, and other operational failures.[208],[209] Studies of residents exposed to benzene following a prolonged flaring disaster at a BP refinery in Texas City, Texas, showed a range of adverse health symptoms and indications of risks of “serious future health complications.”[210],[211] Another detailed the surge of emergency room visits from nearby neighborhoods following chemical releases in 2007 and 2012 at Chevron’s refinery in Richmond, California.[212]
BP’s Texas City refinery was also the site of a massive 2005 explosion that killed 15 refinery workers and injured 180 people. Although comprehensive data on refinery accidents is hard to find, a 2015 investigative piece found that at least 58 workers had died in the decade after the BP explosion, only slightly fewer than in the decade prior.[213] Both the Texas City and Richmond refineries release toxic pollution that disproportionately burdens Black, Brown, Indigenous, and poor communities.
One hazard associated with refineries that has received recent scrutiny is the use of hydrofluoric acid (HF) alkylation to increase the octane of gasoline. HF is a highly toxic chemical that can form an aerosol cloud and potentially travel for miles when released. In 2013, the United Steelworkers and the Tony Mazzochi Center conducted a survey of workers at refineries that use HF and found “131 HF-related incidents or near misses” over three years, and raised concerns about ineffective safety systems.[214] A 2015 explosion at ExxonMobil’s Torrance, California refinery reportedly just narrowly missed causing an HF disaster.[215]
Another chemical that has prompted local concern is hydrogen cyanide (HCN), a refinery byproduct that has also been used as a chemical weapon. Houston, Texas, activists have mobilized to stop Valero’s refinery from receiving a permit for HCN emissions.[216] A review of EPA monitoring data by the Environmental Integrity Project (EIP) found that in 2019, 10 refineries were releasing “cancer-causing benzene into nearby communities at concentrations above federal action levels.”[217] Despite this, a recent investigation found that EPA air pollution monitors routinely miss “major toxic releases and day-to-day pollution dangers” — notably including a massive explosion at the Philadelphia Energy Solutions refinery in 2019.[218]
A 2017 report by the NAACP and the Clean Air Task Force (CATF) provided case studies of health impacts on several communities living near oil refineries, but did not attempt to quantify overall health impacts.[219] A recent expert evaluation concluded, “there is ample evidence of the health hazards of refineries during catastrophic failures and sufficient evidence of the health risks of air pollution from refineries during times of normal operation.”[220]
A series of reports from CATF analyzed the natural gas supply chain, looking at air toxics,[221] ozone formation,[222] and state-level risks.[223] Making use of the EPA’s National Air Toxics Analysis (NATA), the studies concluded that 238 counties in 21 states[224] with a total population of nine million “face cancer risk above EPA’s one-in-a-million level of concern due to toxic emissions from oil and gas operations.” These reports focus on the entire natural gas supply chain, including drilling sites (see previous section), but exclude oil infrastructure such as refineries.
Disproportionate Impact
Studies have found that oil and natural gas facilities are disproportionately sited in vulnerable communities and lead to health disparities. Much of this analysis is focused on the Gulf South region, where much of the nation’s oil, gas, and petrochemical infrastructure is located.
Studies of nationwide and cross-industry RSEI data have concluded that reporting industries generally have higher risks for Black, Brown, Indigenous, and poor communities.[225] Researchers at the Political Economy Research Institute (PERI) have used finer grained geographic microdata (RSEI-GM) to estimate the percentage of each facility’s toxic score that is borne by minority[226] and poor populations. PERI then combines facilities under the same parent company and publishes annual Top 100 Polluter Indexes.[227]
Greenpeace analysis of 2018 PERI data shows that TRI-reporting facilities overall — and most of the top-polluting sectors individually — impose a disproportionate toxic burden on minorities and poor people.[228]
In particular, petroleum refineries and petrochemical manufacturing are among the sectors which impose the most disproportionate toxic burden on minorities and poor people. The 2009 PERI study found that the petroleum refining sector was the 2nd worst industrial sector in terms of both minority and poor shares of its aggregate toxic score.[229] Greenpeace analysis using PERI’s 2018 data shows that 56% of refinery toxic burden is borne by minorities (who make up 39% of the population) and 19% by poor people (who make up 14% of the population). Among the top 10 worst polluting sectors in the 2018 TRI data, the petroleum sector is 2nd worst for minority share, and 4th worst for poor share. In the petrochemical sector, 66% of the toxic burden is borne by minorities and 18% by poor people.
Figure 2 shows 133 U.S. refineries (left) and 48 petrochemical facilities (right) and the share of their pollution burden carried by minorities (x-axis) and poor people (y-axis).
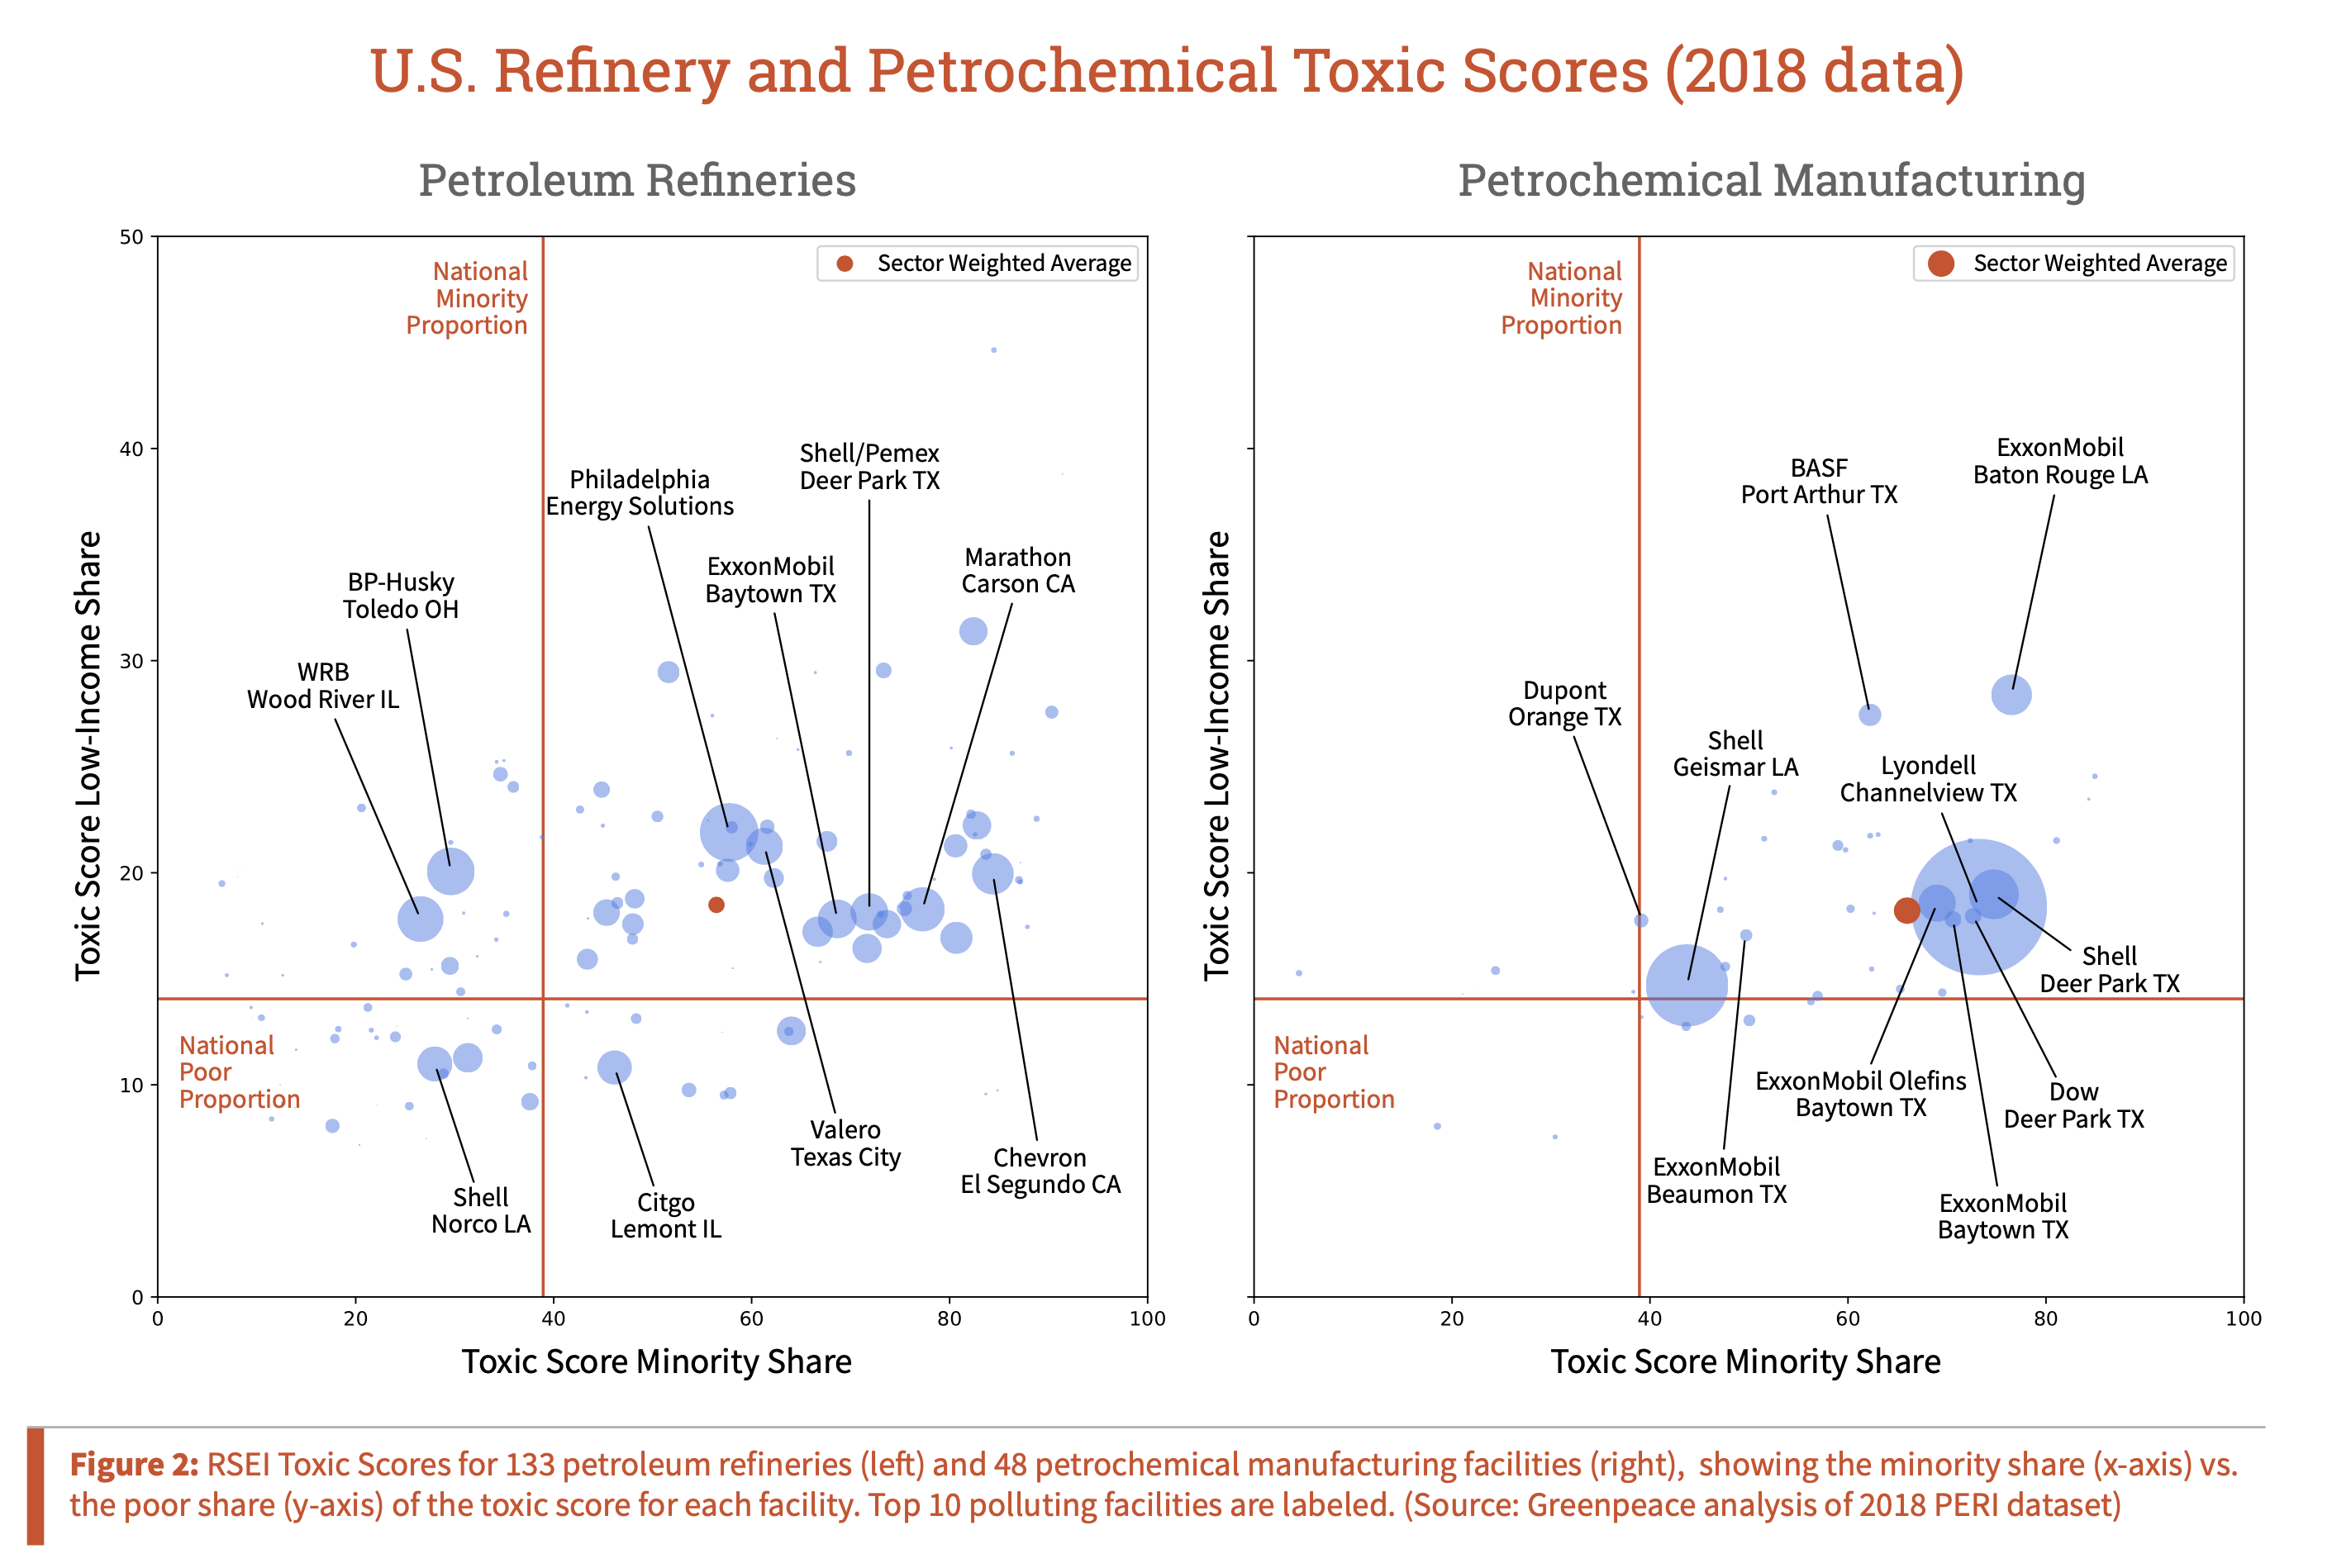
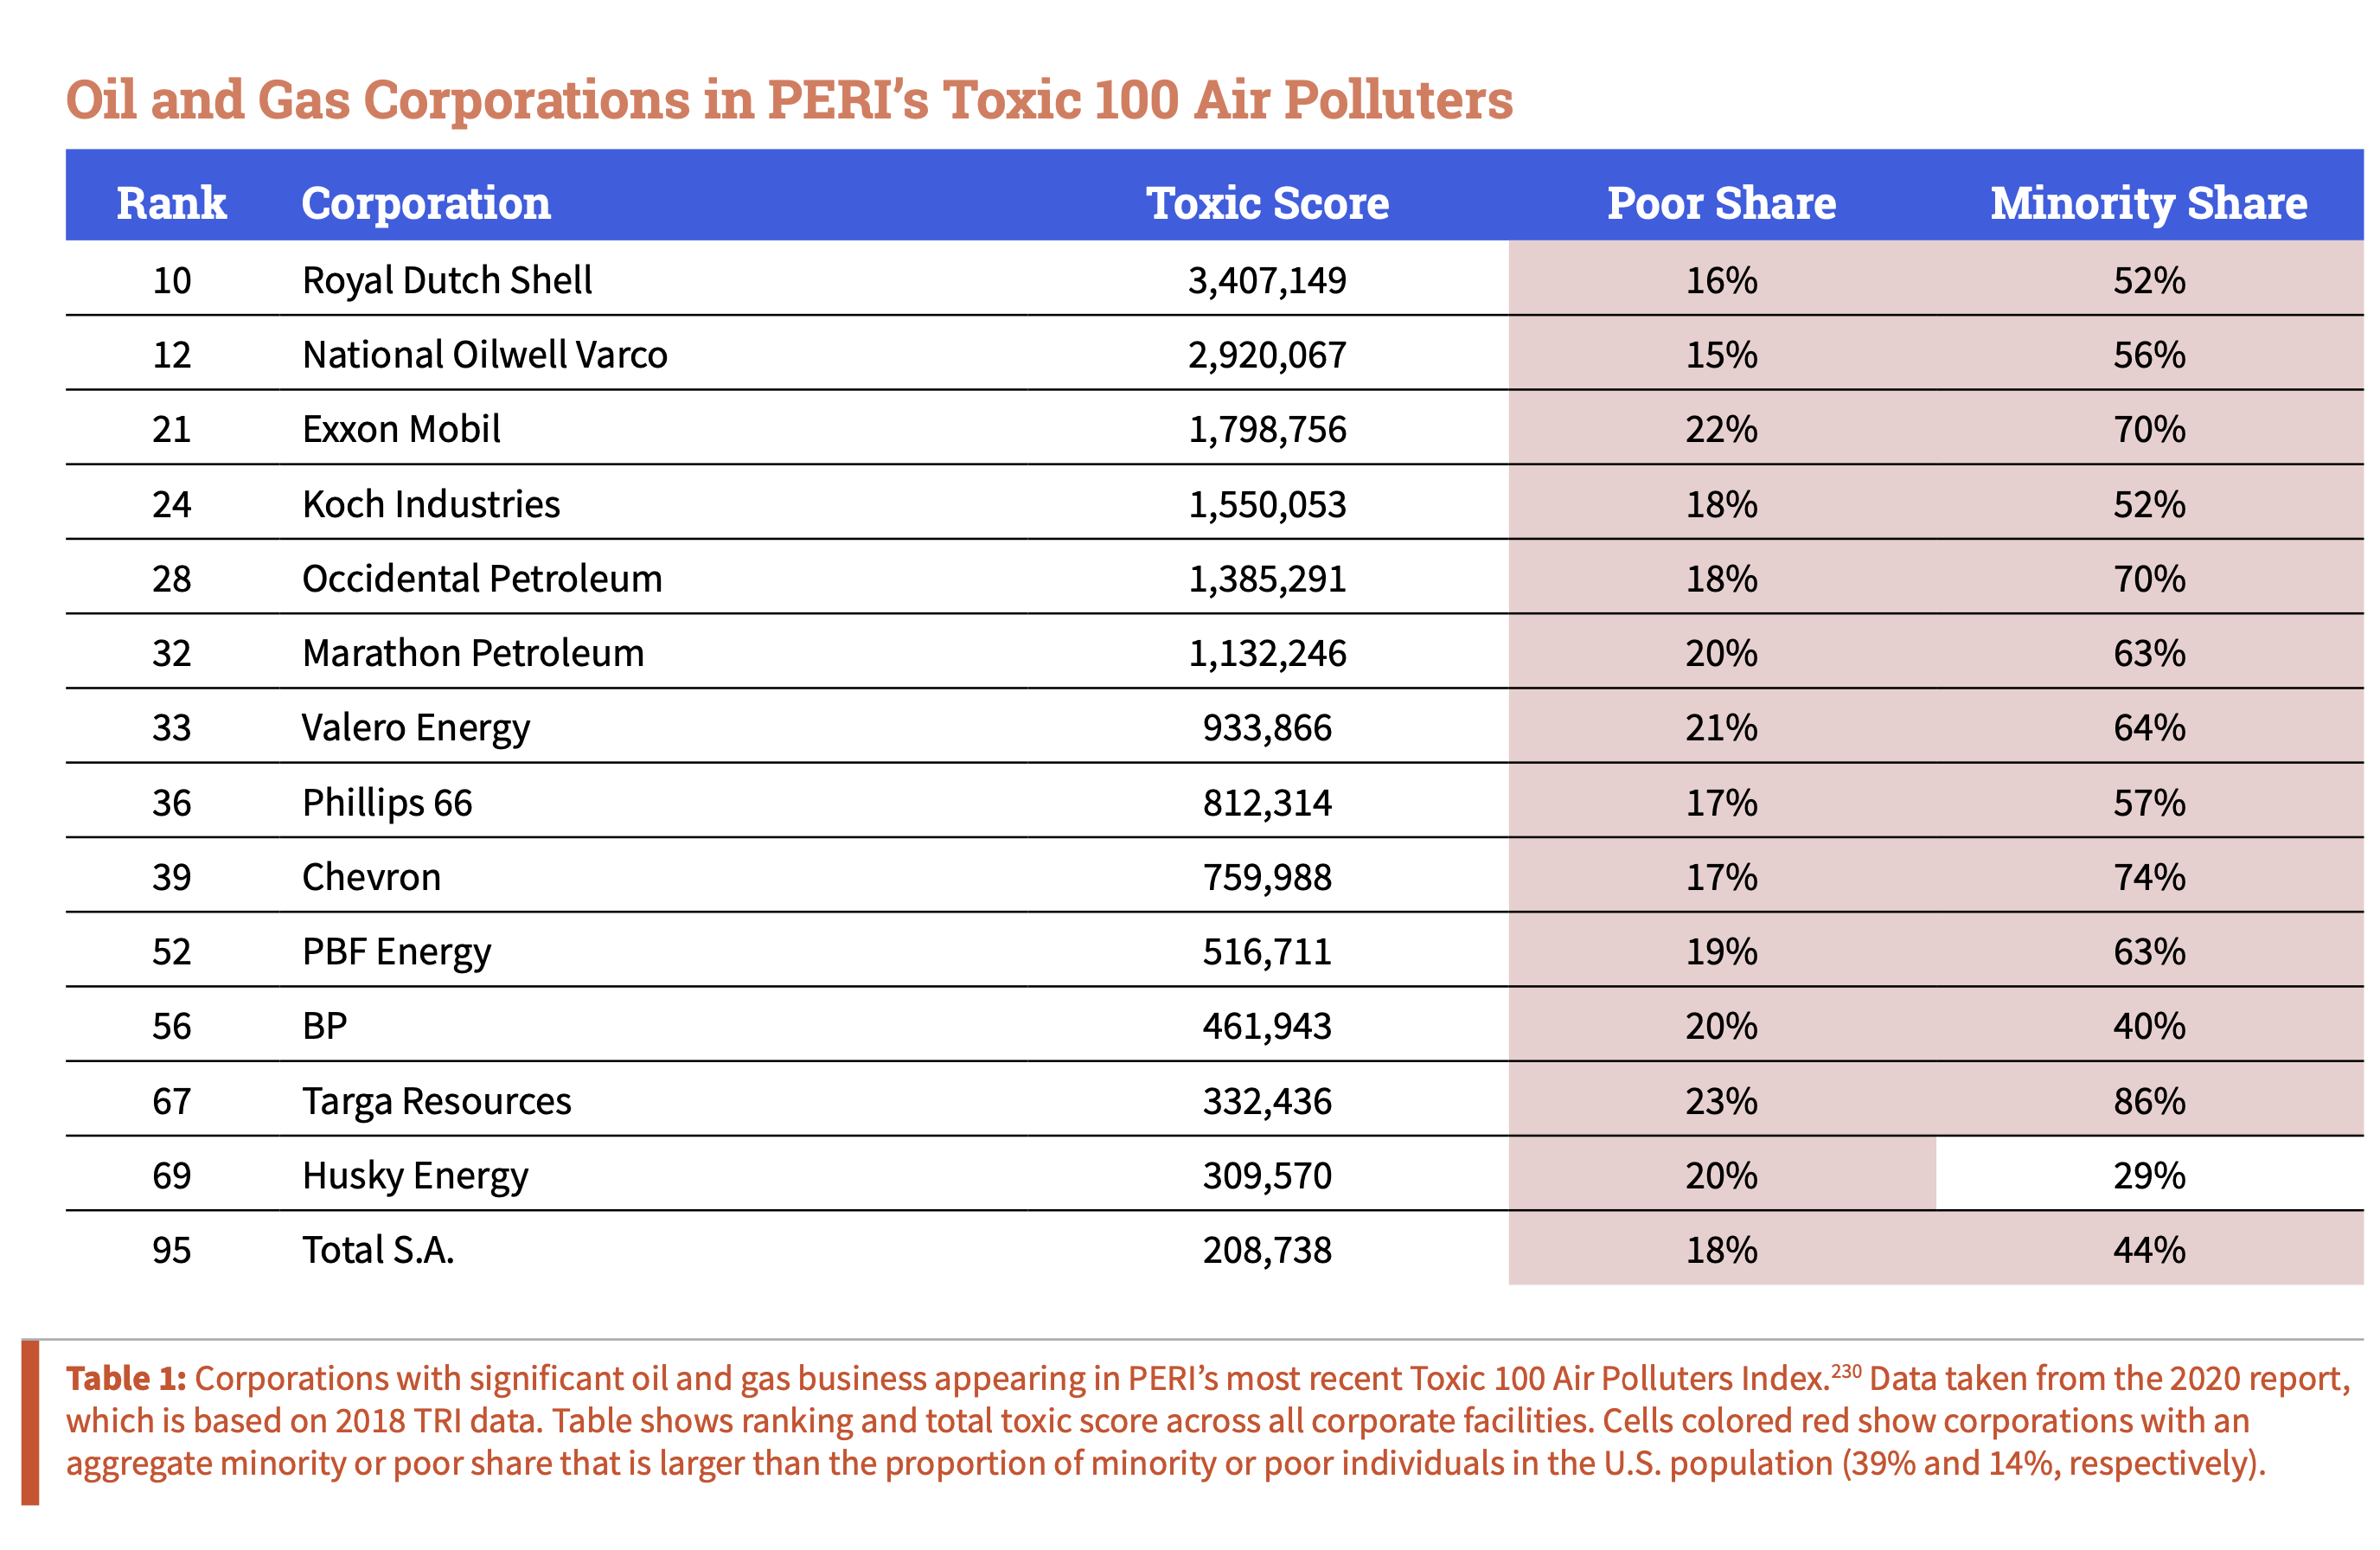
In particular, it is notable that a majority of toxic burden for both refineries and petrochemicals is in regions that are both less-white and lower-income than average (upper right quadrant). This means that the most polluting facilities in these sectors are located in some of the most vulnerable communities, and in many cases have been located in these regions for decades. Table 1 shows that oil and gas corporations are well-represented in PERI’s latest Top 100 Air Polluters list, and that their operations generally disproportionately impact minorities and poor people.
The NAACP/CATF report also concluded that the majority of U.S. refineries “are sited in low-income areas and communities of color” and, in particular, quantified significant health impacts imposed on Black/African-American communities from natural gas infrastructure.[231] In particular, emissions attributed to natural gas infrastructure led to elevated cancer risk impacting one million Black/African-Americans, as well as 138,000 asthma attacks and 101,000 lost school days for Black/African-American children.
A 2016 study by the Union of Concerned Scientists and Texas Environmental Justice Advocacy Services (t.e.j.a.s.) compared health risks from chronic and acute exposure among four communities in Houston, Texas: “two predominantly Hispanic and low socio-economic east Houston communities […] with two primarily white and wealthier west Houston communities.” The study “found large disparities between the east and west Houston communities in terms of overall toxicity levels from chemical exposures,” with oil refineries and chemical manufacturing ranking among the top polluting sources in the east Houston areas.[232]
The petrochemical industry continues to expand along the Gulf Coast and elsewhere, partly driven by plastics production, which is widely seen as a lifeline for oil and gas companies in a time of increasing ambition on climate.[233] In 2020, Formosa Plastics (currently #63 on PERI’s list) received permits to construct a massive petrochemical complex in the “Cancer Alley” region of Louisiana. Local Black environmental justice leaders opposing the complex, including RISE Saint James, assert that Formosa’s permits would double air toxics emissions (including benzene and ethylene oxide) in the region,[234] which is already home to census tracts with some of the highest cancer risks in the United States.[235]
A recent study of the U.S. refinery industry found that refinery capacity is correlated with higher benzene emissions, and such emissions are associated with lower county per-capita income.[236] However, an earlier study of enforcement penalties levied against oil refineries found “mixed evidence” of inequality in enforcement.[237]
Other studies have looked at disparities in exposure to air toxics, without reference to the source. A 2012 study using the 2005 NATA found significant cancer risk disparities in “Cancer Alley,” with poor areas experiencing 16% more cumulative risk and 12% more risk for areas that are greater than 75% Black/African-American.[238] A 2018 study found that nationally, public schools with the highest risk for exposure to air neurotoxicants were “significantly more likely to be eligible for free/reduced price meals, and to be Hispanic, [B]lack, or Asian/Pacific Islander (API).”[239]

Pipelines & Terminals
The network of pipelines is regulated by the Pipeline and Hazardous Materials Safety Administration (PHMSA), which differentiates between crude oil, refined petroleum products, highly volatile liquids (often NGLs), and natural gas. Gathering pipelines, which are smaller and less regulated, take oil and gas from the wellhead to a separation facility and then to the larger transmission pipeline, which transports the separated product to a refinery or other destination. At various places along the network are found tank farms, bulk storage facilities, terminals, and other locations where oil and gas is stored, loaded, unloaded, bought, sold, and traded.[240]
Public Health Harm
Similar to processing facilities, fossil fuel transportation infrastructure is also prone to leaks, spills, explosions, and other disasters.
There is no safe way to transport oil and gas.[241] The oil and gas pipeline network experiences a steady drumbeat of small- to medium-sized spills and leaks every year, as well as occasional catastrophic spills such as the 20,000 barrel tar sands spilled into the Kalamazoo River in 2010. Stronger regulations have led to meaningful declines in spills from oil tankers,[242] but risks of another Exxon Valdez-like spill still remain. Transporting oil or gas by truck or train also brings significant safety risks, as illustrated by a 2013 derailment and explosion in Lac-Mégantic, Quebec that killed 47 people.[243] Transporting coal can lead to coal dust pollution.[244]
Disproportionate Impact
With the shale boom, the United States has seen a rapid build-out of oil and gas pipelines, as well as liquified natural gas (LNG) and crude export terminals. The vast majority of this infrastructure build-out is funneling oil and gas from places like the Bakken, Niobrara (located primarily in Colorado and Wyoming), and Permian regions south to the Gulf Coast, where it is processed or (increasingly) exported. This new terminal and pipeline build-out has the effect of converging significant volumes of oil and gas into regions that are already experiencing environmental justice burdens. These include Corpus Christi, the Houston Shipping Channel,[245] Beaumont, Port Arthur, the “Cancer Alley” region of Louisiana, and other Gulf South communities.
Greenpeace analysis of the 2018 RSEI data finds that the more than 400 Petroleum Bulk Stations and Terminals reporting to TRI are much smaller emitters than refineries or petrochemical plants, but are similarly disproportionately located in poor (19% of toxic score) and minority communities (71% of toxic score).[246]
Pipeline construction has become a particular environmental justice flashpoint in recent years. The construction of the Dakota Access pipeline in 2016 led to massive resistance by Water Protectors at Standing Rock. One issue in that controversy was the apparent rerouting of the pipeline away from a majority White community in favor of a route that put Tribal water resources at risk.[247]
Other major pipeline projects — including the now-canceled Keystone XL, the Transmountain Expansion, and the Line 3 Expansion — have also attracted strong opposition from Indigenous and First Nations activists, as well as from other communities along the routes. A 2018 study found evidence that disproportionately large numbers of Black/African-American, Hispanic, and Indigenous residents live within one mile of the proposed Atlantic Coast Pipeline (ACP) route in North Carolina.[248] The ACP project was canceled in 2020.
The routing of pipelines from extraction regions to processing or export locations is subject to different pressures and processes than the siting of point source facilities like refineries. In particular, the origin and destination of a pipeline are usually fixed by geography and existing infrastructure. While there are choices that are made about the intervening route, many pipelines are routed through low-population density rural areas for much of their length. Pipeline build-out often facilitates an expansion of oil and gas drilling and processing, and can lock in dependence on oil and gas.
However, a 2021 study looking at 84 new, proposed natural gas pipelines found only limited support for the hypothesis that the proposed routes disproportionately impacted environmental justice communities. The authors noted the importance of further research to see if this remains the case for completed pipelines.[249]

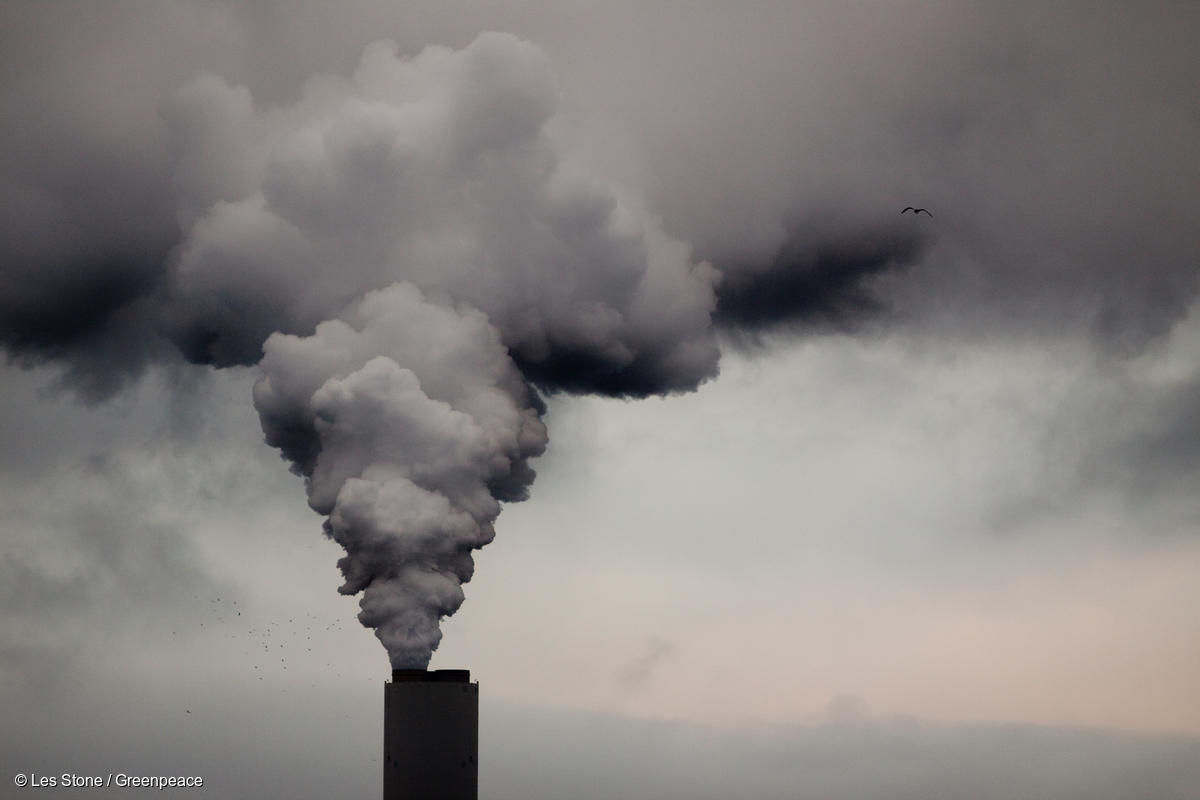
6. Combustion
The end use of most (but not all) fossil fuels is combustion for energy, which can occur in both stationary sources (e.g., power plants and industrial facilities) and mobile sources (e.g., cars and trucks). As discussed above, criteria air pollution from the combustion of fossil fuels is one of the most significant global health burdens, and is linked to millions of premature deaths every year globally.
General Exposure to Criteria Air Pollution
Public Health Harm
A 2020 study by Greenpeace Southeast Asia and the Centre for Research on Energy and Clean Air (CREA) estimated that in 2018, 4.5 million premature deaths worldwide could be attributed to PM2.5, ozone, and NOx air pollution from burning fossil fuels. It was estimated that health impacts arising from these pollutants cost roughly US$8 billion per day, or 3.3% of the world’s GDP.[250] (In calculating economic costs of air pollution, researchers often include the economic value of lost years of life, lost days of work, and healthcare costs.) In the United States alone, the report found that air pollution due to fossil fuel combustion causes 230,000 premature deaths each year, with an economic cost of US$600 billion.
A 2021 study found even higher numbers: 8.7 million premature deaths globally in 2018 due to PM2.5 from fossil fuels, and 355,000 premature deaths in the United States.[251] The elevated numbers were the result of new information on the concentration-response function of PM2.5, which relates the size of health effects to the level of PM2.5 in the environment to which humans are exposed.
A small portion of the carbon associated with fossil fuels ends up stored in commercial products (e.g., plastics, lubricants, asphalt) instead of being combusted as fuel. Some of those products (notably plastics) are later incinerated at the end of their commercial life, which can lead to both carbon emissions and air pollution. Plastic incineration can result in emissions of dioxin and other air toxics.[252]
Disproportionate Impact
In the context of the United States, studies have shown that exposure to air pollution is not shared equally. A 2018 study found that for PM2.5, “those in poverty had 1.35 times higher burden than did the overall population, and non-Whites had 1.28 times higher burden.” The burden for Black/African-Americans was even higher at 1.54.[253] Similarly, a 2019 study looked at both PM2.5 exposure and consumption patterns that lead to air pollution, and again concluded that “Blacks and Hispanics on average bear a ‘pollution burden’ of 56% and 63% excess exposure, respectively, relative to the exposure caused by their consumption.”[254] Ozone pollution is also found to have a disproportionate impact on Black, Brown, Indigenous, and poor communities.[255]
Over the last several decades, clean air regulation in the United States has significantly reduced pollution levels,[256] although from 2016 to 2018 pollution levels partially rebounded.[257] However, a 2020 study found that PM2.5 disparities have persisted even as overall levels have declined — i.e., “the most polluted census tracts in 1981 remained the most polluted in 2016.”[258]
People of color are also more likely to live in areas that violate air quality standards. For example, a 2011 study found non-Hispanic Black/African-American people are “consistently overrepresented in communities with the poorest air quality,”[259] and nearly 50% of Hispanic-Americans live in areas that frequently violate ozone standards.[260]
These broad, nation-wide studies give high-level statistical evidence that Black, Brown, Indigenous, and poor communities suffer disproportionately from fossil fuel combustion. Other studies have looked more closely at particular sources, including coal and natural gas power plants, as well as emissions from transportation.

Coal and Natural Gas Power Plants
Coal- and natural gas-fired power plants are among the largest sources of air pollution, both globally and in the United States.
Although not a main focus of this report, other types of industrial facilities use fossil fuels for on-site energy generation and industrial processes that require high heat — in particular, iron and steel production and various types of manufacturing. Both criteria and air toxics emissions from these industrial sites can be significant, and bring health risks for local communities.[261] Decarbonization strategies for industrial sector emissions must also focus on eliminating criteria and hazardous pollutant emissions and alleviating environmental justice concerns.[262]
Public Health Harm
Numerous studies have linked coal combustion to significant human health, economic, and environmental harms.[263],[264] One study found that the full lifecycle costs of coal to the U.S. public was between $175 and $523 billion every year, with a significant portion of that total ($65 to $187 billion) from monetized health impacts from coal combustion in power plants.[265] As described above, these health impacts are primarily due to exposure to criteria air pollutants PM2.5, NOx, and SO2, but coal plants are also a significant source of mercury as well as various hazardous and carcinogenic air pollutants.[266] Coal plants also generate coal ash as a waste product, which can be harmful as it is often improperly stored and can lead to disasters such as the 2008 Kingston coal ash spill.[267]
In 2015, the Obama administration finalized its Clean Power Plan (CPP) to reduce CO2 emissions from the nation’s fleet of power plants. EPA analysis of the rule projected it would lead to a 32% decline in CO2 emissions and a 22% decline in coal generation by 2030.[268] These reductions would come with co-beneficial reductions in PM2.5 and ozone levels that would avoid 1,500 to 3,600 premature deaths and 90,000 childhood asthma attacks in the year 2030.[269] In 2019, the Trump administration finalized a significantly weaker rule replacing the CPP. The Trump administration’s rule, which would have led to as many as 1,400 additional deaths per year compared to the CPP, was struck down by a federal appeals court in January 2021.[270]
Recent studies have measured the health benefits of phasing out fossil fuel power plants. By taking advantage of a “natural experiment” when eight coal and oil power plants were retired in California, researchers were able to measure improvements in the health of nearby populations. The study found plant retirement was associated with a “decrease in the proportion of preterm birth” for mothers living within six miles (10 kilometers).[271] A similar study found improved asthma outcomes following the conversion and retrofitting of coal plants in Kentucky.[272]
Another study analyzed the impacts of closing coal plants in Texas and concluded that “air pollution health impacts often exceed the value of the electricity generated and are of similar magnitude to climate impacts.”[273] In the U.S. Northeast, the Regional Greenhouse Gas Initiative (RGGI) — a carbon market designed to reduce power sector emissions — was also found to reduce NOx and SO2 emissions, and related regional PM2.5 concentrations. These reductions were estimated to bring “substantial child health benefits,” including avoided asthma cases and avoided preterm births. The study did not attempt to investigate disparities in health impacts by race or income.[274]
Natural gas-fired power plants do not directly generate as much particulate, mercury, or SO2 pollution, although they do generate NOx emissions, which can lead to ozone and PM2.5 via secondary processes. What’s more, natural gas power plants are more likely than coal to be located in denser areas, thereby increasing exposure to pollution.[275] So, while natural gas power generation can have lower health impacts than coal, it is not “clean” in comparison to renewable power sources.[276]
Disproportionate Impact
A 2012 study led by the NAACP found that “coal power plants tend to be disproportionately located in low-income communities and communities of color.”[277] The study found that the six million people who lived within three miles of a coal plant had a lower average income ($18,400) and were more likely to be people of color (39%) than the population at large ($21,587 and 36%, respectively). The report also gave 75 coal plants a failing grade on environmental justice due to their outsized pollution impacts and disproportionate siting in Black, Brown, Indigenous, and poor communities.
Subsequent government studies have confirmed this finding. A 2015 EPA analysis carried out in support of the Clean Power Plan found “a higher percentage of minority and low-income communities living near power plants than national averages,” although the analysis noted wide variability in impacted populations.[278] A 2017 study by Oak Ridge National Laboratory similarly found that the share of minorities living within three miles (five kilometers) of a coal- or oil-fired power plant is 12% larger than the national average.[279]
Other state-level studies have also found disproportionate impacts from the power sector. In California, the state’s CalEnviroScreen 3.0 tool shows that half of all natural gas plants are “located in communities that rank among the 25% most disadvantaged.”[280] In Pennsylvania, one study found that the state’s 88 “existing power plants were disproportionately located near disadvantaged communities,” and that new proposed plants would exacerbate these disparities.[281]
The power sector has shifted rapidly in recent years, with cheap renewables and natural gas pushing many coal plants into retirement. A 2020 study found that recent coal retirements had decreased overall PM2.5 impacts, but “disparities between White and non-White subgroups increased” and burdens remains highest for “below-poverty and non-White subgroups.”[282]
A recent study by PERI found that the proportion of Black and Hispanic residents living within three miles (five kilometers) of a power plant was higher for natural gas (13.4% Black, 19.8% Hispanic) than for coal (8.1% Black, 6.1% Hispanic). While overall co-pollutant damages from coal are roughly eight times higher than for natural gas, the coal impact on Hispanic and Black populations is only three to four times greater than natural gas. This data indicates that a climate policy that prioritizes switching from coal to natural gas as a “bridge fuel” risks worsening relative pollution disparities, and in some cases, increasing absolute pollution levels in minority communities.[283]
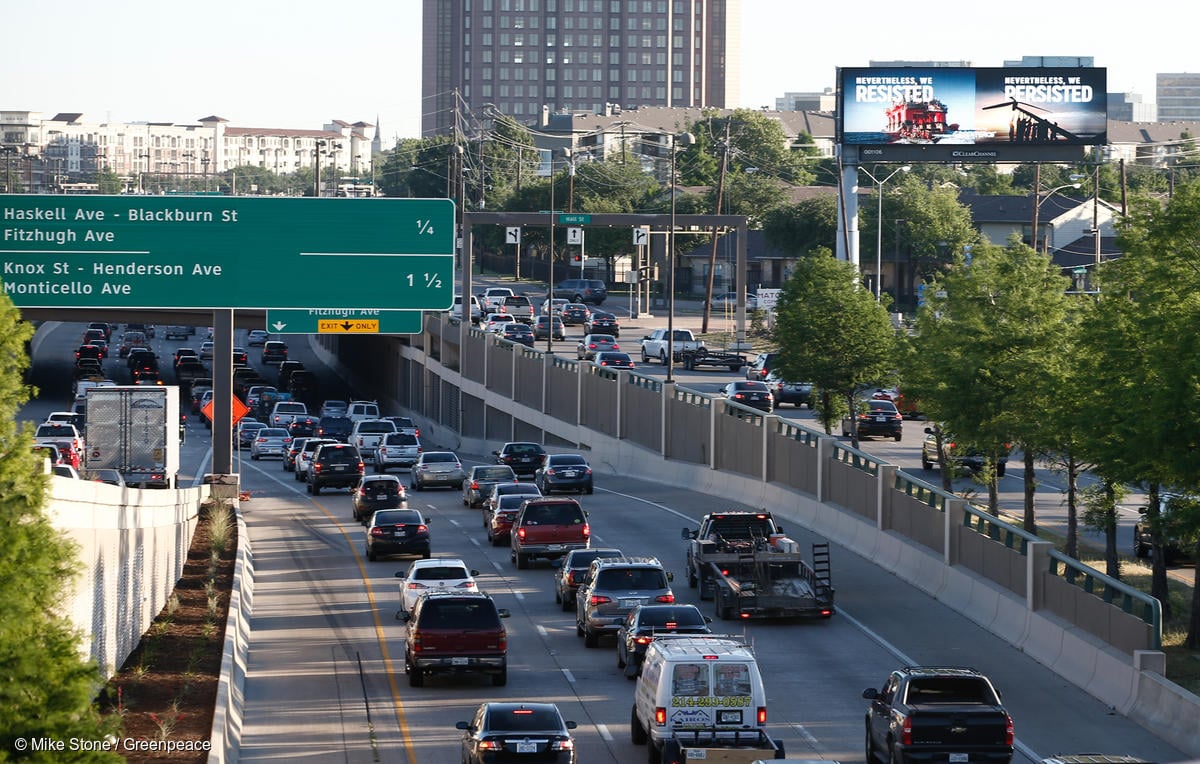
Mobile Sources and Traffic Exposure
Mobile sources of air pollution, such as tailpipe emissions from gasoline or diesel engines in cars and trucks, also have significant health impacts.[284]
Public Health Harm
Mobile sources are a key factor in exposure to both PM2.5 and ozone. The EPA notes that people who live, work, or attend school near high-traffic roadways are exposed to higher levels of air pollution and suffer adverse health impacts as a result.
Studies have found evidence that exposure to traffic is linked to worsened childhood asthma, cardiovascular mortality,[285] and other adverse effects.[286] The EPA conducted air quality modeling in connection with its 2012 rulemaking on emissions standards for cars and trucks.[287] The agency’s regulatory impact analysis (RIA) concluded that improved standards would have “substantial” health benefits both in terms of reduced mortality and net economic benefits.
In March 2020, the Trump administration finalized a much weaker rule that rolled back the Obama-era standards and revoked California’s unique authority to set stronger vehicle standards.[288] Taken together, these two rollbacks would increase cumulative greenhouse gas emissions by over a gigaton from 2020 to 2035.[289] Higher levels of air pollution due to the rollback could also lead to up to 32,000 additional premature deaths from 2017 to 2050.[290]
Disproportionate Impact
Demographic patterns of major U.S. urban areas have been profoundly shaped by the history of racial discrimination, including policies of redlining and housing discrimination.[291] These patterns were also compounded, in certain U.S. cities, by decisions in the 1940s and ‘50s to construct major highways through so-called “blighted” areas, erasing some neighborhoods and hemming others in with traffic corridors.[292]
Studies are beginning to explore how these historical patterns have persisted and have uncovered correlations between past redlining practices and present day health burdens. One study of eight California cities found that neighborhoods described as high foreclosure risk in the 1930s were currently associated with higher diesel exhaust pollution levels, higher proportions of minority and poor residents, and a 2.4 times higher rate of asthma-related emergency room visits.[293] Another study that looked at 108 cities nationwide found that previously redlined neighborhoods are disproportionately exposed to extreme heat, and are an average of 2.6°C hotter than non-redlined areas.[294]
Although the sale of leaded gasoline was phased out by the EPA beginning in the 1970s, lead persists in the environment and remains a health hazard. Exposure risks from lead-contaminated soil are often concentrated in urban centers and reflect historical traffic patterns — and thus historical fossil fuel usage.[295]
The EPA’s 2012 clean car standards RIA presented evidence that people “living near roads are often socioeconomically disadvantaged,” noting that rental properties are twice as likely to be located near large highways, railroads or airports than owner-occupied properties. One U.S.-wide study found “greater traffic volume and density are associated with larger shares of non-white residents and lower median household incomes.”[296] Note that air pollution exposure also occurs during daily travel and at work, and mobility should be taken into account in estimating exposure.[297],[298]
A number of studies of specific urban areas have also found “higher levels of traffic-related air pollutants in areas with high minority or poor populations.”[299],[300],[301] The EPA’s 2012 clean car standards RIA also summarized studies showing that students attending schools with high traffic exposure are “more likely […] to be of non-white race or Hispanic ethnicity, and more often live in low socioeconomic status locations.”
7. Climate Impacts
Greenhouse gas emissions from fossil fuel usage are the principal factor driving the climate crisis. Climate change is already manifesting itself in a myriad of different forms — from sea-level rise to increased flood risk, from melting permafrost to heat waves, from stronger hurricanes to longer wildfire seasons — with significant consequences for human health and communities.
Public Health Harm
The impacts of climate change on human health have been well-studied on both a global scale[302] and in the United States.[303] Globally, climate change “threatens to undermine the past 50 years of gains in public health, disrupting the well-being of communities and the foundations on which health systems are built.”[304] Should the planet remain on a high emissions trajectory, changes in rainfall patterns[305] and losses of biodiversity[306] will threaten food security for people living in many regions.
In the United States, health hazards related to climate change include “altering exposures to heat waves, floods, droughts, and other extreme events; vector-, food-, and waterborne infectious diseases; changes in the quality and safety of air, food, and water; and stresses to mental health and well-being.”[307] Policies to limit emissions could save thousands of lives and hundreds of billions in health-related costs in the United States by the end of the century.[308]
This report has focused on air pollution and its health impacts. Climate change has the potential to increase ozone concentrations, and by amplifying wildfire impacts, can increase PM2.5 concentrations during wildfire season. The 2020 California wildfires are estimated to have contributed to over 1,000 premature deaths due to air pollution alone.[309]
Climate change is predicted to increase the frequency and intensity of heat waves, hurricanes and tropical storms, floods, droughts, wildfires, and other weather events. These events can directly harm human health, and can also disrupt public health and health care systems. It is not always possible to directly attribute an individual extreme weather event to climate change, although scientists have made rapid advances in this area.[310] In 2020, the National Oceanic and Atmospheric Administration (NOAA) identified a record-breaking 22 weather/climate disasters that cost over $1 billion in damages each, including seven tropical storms, drought and heatwave in Western states, and the West Coast wildfires.[311] Those 22 events led to 262 deaths and caused a total of $95 billion in damages.
Extreme heat is one of the most direct human health threats arising from climate change. Places such as the Persian Gulf and South Asia may see heat-wave temperatures that approach or exceed the “limit of human survivability” by the end of the century under a high emissions scenario.[312] In the United States, the National Climate Assessment finds that heat-related deaths from warming will outweigh reductions in winter mortality. Limiting climate change could reduce excess heat mortality by over 5,000 deaths per year by the end of the century (in comparison to the high emissions scenario, and without considering adaptation).[313]

Disproportionate Impact
Much like air pollution risk, climate change impacts will be unevenly and inequitably shared across the United States[314] and the world. Globally, the United Nations has concluded that “Climate change will have devastating consequences for people in poverty. Even under the best-case scenario, hundreds of millions will face food insecurity, forced migration, disease and death.” Climate inaction would be “disastrous for the global economy and pull vast numbers into poverty.”[315]
Lower-income regions in the Southeast, with the largest Black/African-American populations in the United States, are among the highest-risk,[316] including many communities already experiencing high pollution burdens and a legacy of environmental racism. The 2018 National Climate Assessment concluded, “People and communities are differentially exposed to hazards and disproportionately affected by climate-related health risks,” and notes elevated risks for children, older adults, low-income communities, communities of color, outdoor workers, and “communities disproportionately burdened by poor environmental quality.” Lower-income households generally have lower GHG emissions and do not contribute to global climate change at the same scale as high-income households.[317]
The U.S. health system is already plagued by many of the same concerns about systemic racism and inequality, as well as a financial structure that leaves many millions without reliable health insurance. The American Public Health Association (APHA) has warned that the “same physical, social, economic, and services environments that are associated with poor health outcomes for low-income communities and communities of color also increase exposure and vulnerability to the health impacts of climate change.”[318]
Alaska Native and Indigenous communities are among the first to experience some of these climate impacts — and are among the United States’ first internal climate migrants. Retreating sea ice, increased erosion, and winter storms are forcing several Alaskan villages, such as Kivalina, to relocate to more secure ground.[319] Along Louisiana’s coast, rising sea levels and rapid erosion are also forcing Native communities to consider relocation.[320]
Research has shown that the response to climate-driven natural disasters is shaped by and can amplify existing inequalities.[321] Studies looking at the aftermath of Hurricanes Maria and Harvey have found increases in air pollution,[322] threats to water quality,[323] and even the redistribution of existing toxic pollution by floodwaters.[324] In August 2020, Hurricane Laura hit the coast of Louisiana and was immediately followed by a heat wave, impacting a region already suffering from the Covid-19 pandemic, health inequalities, and environmental racism. The hurricane forced emergency shutdowns of numerous refineries and petrochemical plants along the coast, leading to elevated toxic emissions. Hurricane damage triggered a catastrophic chemical plant fire near Lake Charles, releasing chlorine gas and other pollutants, and forcing nearby residents to shelter-in-place and close windows to avoid exposure.[325]
Urban Heat Islands (UHI) can amplify the impact of warming by increasing heat exposure during the day and preventing cooling off at night. Research has found that in 25 cities around the world, 72% of poorer neighborhoods experienced elevated heat exposure — a factor that was potentially mitigated by increasing green space in urban areas.[326] The same pattern holds for most cities across the United States, with studies showing that poor people and people of color live in hotter neighborhoods.[327],[328] As noted earlier, exposure to extreme heat is associated with past patterns of redlining.[329] A recent study by the real estate company Redfin also found that formerly redlined areas faced 25% higher flood risks than non-redlined areas, and that those risks were disproportionately borne by people of color, who make up 58% of residents in the formerly redlined neighborhoods studied.[330]
A broad review of health studies found that Black mothers were most at risk from overlapping exposure to air pollution and heat stress, putting them at greater risk of adverse pregnancy outcomes such as preterm birth, low birth weight, and stillbirth.[331] Other groups that face elevated risk of extreme heat include children, the elderly, and outdoor workers, such as agricultural workers and others.
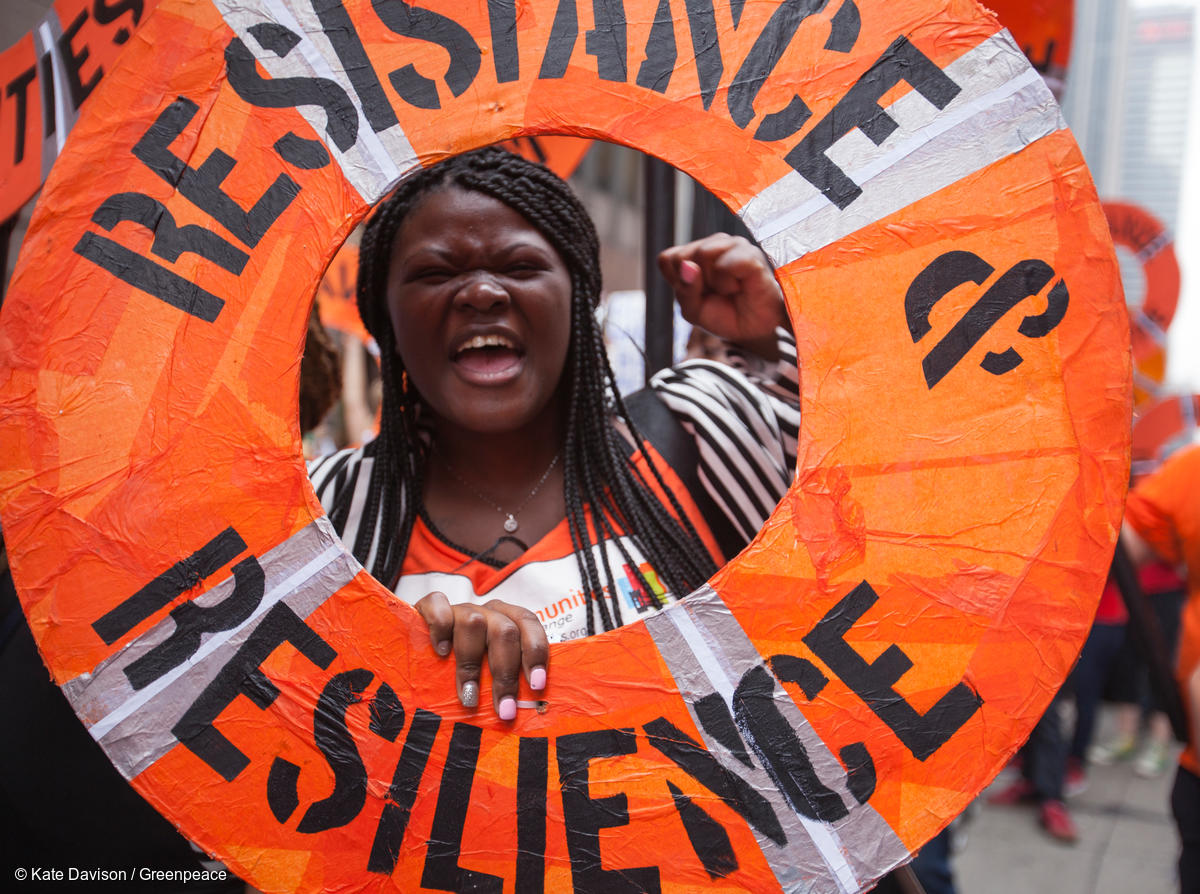
8. Policy Recommendations
As the nation emerges from the COVID-19 pandemic, President Joe Biden and the 117th Congress have a historic opportunity to kick off an ambitious national policy program that puts the United States on a path to rapid decarbonization while ensuring justice for workers and communities. Our national response to the overlapping crises we face must explicitly aim to end fossil fuel racism.
Fossil fuels generate dangerous pollutants at each stage of their lifecycle, from hazardous air toxics emitted from fracking wells to deadly criteria air pollutants and greenhouse gases emitted when they are burned. This pollution harms public health and is driving civilization into existential crisis — and these harms are disproportionately carried by Black, Brown, Indigenous, and poor communities. The time has come to phase out fossil fuel production, build a better economy to take its place, and ensure that workers and communities are made better off through the transition.
The current political opportunity to enact policies to address climate change is also a chance to reduce public health harms and partially alleviate the history of environmental racism — but only if those goals and stakeholders are included in policy design from the start. Pursuing “carbon-only” policies with an eye to extending the life of the fossil fuel industry will only delay and deny justice for communities suffering from toxic legacies and ongoing pollution burdens.
President Biden and Congress must confront the overlapping crises we face with a holistic approach to improve public health, tackle the climate crisis, and rectify our legacy of systemic racism by phasing out fossil fuel production. Our policy recommendations are rooted in Greenpeace USA’s Just Recovery Agenda[332] and the Movement for Black Lives’ Red, Black, and Green New Deal platform. To truly Build Back Better, President Biden and Congress must:
- End fossil fuel racism and reverse the legacies of historical injustices.
- Phase out fossil fuel production.
- Ensure no worker or community is left behind.
- Enact a green and just economic recovery.
- Protect and expand our democracy to make it work for all people
1. End fossil fuel racism and reverse the legacies of historical injustices
We must end fossil fuel racism and reverse the legacies of past injustices by placing both resources and power in the hands of impacted communities. Policies to accomplish this vision include:
- Require air and water pollution reductions in environmental justice communities to reduce pollution and pollution disparities by implementing a comprehensive “No Pollution Hotspots” policy.[333]
- Study, measure, and mitigate cumulative impacts of pollution from multiple sources, including legacy pollution.
- Strengthen equity and environmental justice mapping tools to provide more information to the public about health harms and disparities.[334]
- Institutionalize Free, Prior, and Informed Consent to require consent of American Indian and Alaska Native tribes and Indigenous peoples regarding federal actions affecting their lands, livelihoods, culture, and spirituality.
- Pass the Environmental Justice for All Act to provide legal remedies to citizens, improve equity mapping tools, expand grant programs, and strengthen consultation with impacted communities.[335]
- Elevate environmental justice to the highest levels of governance, including by passing the Climate Equity Act.[336]
- Strengthen the National Ambient Air Quality Standards to align with the best available science and end the politicization of air pollution at the EPA.
- Enact stronger standards, monitoring, and enforcement for hazardous air pollutants under the Clean Air Act.
2. Phase out fossil fuel production
We must halt the expansion of fossil fuel production and infrastructure, and put the industry on track for a just, equitable, and well-managed phaseout of fossil fuel production consistent with a pathway to limit global warming to below 1.5°C. This phaseout must go hand-in-hand with investments in economic security for workers and communities affected during the transition. Policies to accomplish a fossil fuel phaseout include:
- Pass the End Polluter Welfare Act to eliminate federal fossil fuel subsidies, including tax breaks, bailouts, loan guarantees, below-market royalties, and public finance.[337]
- Reinstate the crude oil export ban[338] and prohibit exports of liquified natural gas (LNG) and coal.
- Ban new fossil fuel leasing and permitting on public lands and waters, and phase out existing leases.
- Evaluate lifecycle greenhouse gas emissions for all federal infrastructure projects and reject federal permits for projects that would exacerbate the climate crisis.
- Strengthen “polluter pays” requirements, including bonding levels and fees, on oil and gas wells and coal mines to ensure fossil fuel corporations pay the full cost of remediation.
- Pass the Break Free from Plastic Pollution Act.
- Establish a national plan and targets to wind down existing fossil fuel production and infrastructure.
- Supporting the establishment of one-mile (minimum 2,500-foot) public health and safety buffer zones to ensure that no oil and gas production occurs near where people live, work, learn, and play.[339]
3. Ensure no worker or community is left behind
We must ensure that workers and communities will be better off during the transition to a more just and regenerative economy. We must invest in economic security and opportunities for workers and communities affected by the transition. Policies to realize this support include:
- Enact the Protecting the Right to Organize (PRO) Act to better enable workers to act in solidarity with one another, punish corporations that break the law, limit tactics that intimidate workers, help secure timely collective bargaining agreements, and make it easier for workers to form and join unions.
- Mandate the use of project labor agreements, Davis-Bacon prevailing wage requirements, community benefit agreements, and high-road labor standards in any federally funded project.
- Establish a federal oil well remediation program to create 250,000 high-quality jobs cleaning up abandoned oil and gas wells.[340]
- Provide good jobs cleaning up abandoned mines and fostering economic development in coal communities.
- Create a federal “Energy Worker and Community Protection Fund”[341] to guarantee wage, benefit, and pension protections for workers affected by the transition away from fossil fuels, replace lost tax and community revenue, and promote community revitalization and economic development for affected communities.
4. Enact a green and just economic recovery
We must enact a green and just economic recovery that includes rigorous climate standards to keep temperature increases below 1.5°C. Trillions of dollars in public investment are needed to secure a clean energy economy and guarantee essential public goods for all people. Strong policies are essential to ensure justice and equity for Black, Brown, Indigenous, poor people, and other disadvantaged workers and communities. Policies to accomplish this goal include:
- Pass the THRIVE Act to invest at least $1 trillion per year for the next decade to create 15 million good jobs, cut climate pollution in half by 2030, and confront systemic racism and gender, economic, and environmental injustice.[342]
- Honor frontline leadership with a representative governing board to guide federal investments.
- Ensure at least 50% of new investments directly benefit frontline and disadvantaged communities.
- Ensure federal investments pass a rigorous environmental justice and equity screen to avoid exacerbating “pollution hotspots.”
- Uphold strong labor, climate, and equity standards to protect and expand workers’ rights, mitigate the climate crisis, and ensure investments repair, rather than exacerbate, historic injustices.
5. Protect and expand our democracy to make it work for all people
Our democracy is in peril. We must protect people’s rights to have a voice in the democratic process, get corporate money out of politics, defend the fundamental right to protest, and transform the current system to a people-powered democracy that works for all. Policies to achieve this vision include:
- Pass the For the People Act (H.R.1 / S.1) to give more electoral power to the people by getting big money out of politics, restoring voting rights, offering new protections for voters, ending gerrymandering, and holding government officials accountable.[343]
- End the Jim Crow filibuster to preserve the will of the majority to enact laws that will address the crises we face and ensure all communities can thrive.
- Pass the John Lewis Voting Rights Act (H.R.4) to protect against racist voter suppression tactics and strengthen our electoral system.[344]
- Grant statehood to Washington, D.C., by passing H.R.51, to ensure more than 700,000 thousand residents, a plurality of whom are Black, are afforded the same protections, access, and rights in our democracy that residents of every other state enjoy.[345]
- Passing a constitutional amendment to overturn the Citizens United U.S. Supreme Court ruling, which gives corporations and fossil fuel industry leaders unprecedented access to influence elected officials.[346]
- Enact the BREATHE Act to protect communities from police brutality and racial injustice by investing in Black communities and re-imagining community safety.[347]

Acknowledgments
This report is a joint project of The Movement for Black Lives, Gulf Coast Center for Law and Policy, and Greenpeace, Inc. (“Greenpeace USA”).
The authors are grateful to the following reviewers for their insightful feedback and guidance: Noel Healy (Salem State); Aidan Farrow (Greenpeace International Science Unit); Ashley Thomson, Jonathan Butler, Caroline Henderson, Charlie Cray, Anusha Narayanan (all with Greenpeace USA); and Angela Mooney D’Arcy (Sacred Places Institute). We are grateful to Michael Ash (PERI) for providing their dataset and valuable guidance in analyzing the RSEI data. Any errors in this report are the responsibility of the authors.
This report was written by Tim Donaghy and Charlie Jiang of Greenpeace USA, with contributions from Colette Pichon Battle and Emma Collin (Gulf Coast Center for Law and Policy), and Ryan Schleeter and Janet Redman (Greenpeace USA). The report was edited by Charlie Jiang and designed by Katie Myer, Kyle McKibbin, and Jacob Hardbower.
Greenpeace USA acknowledges that the development of this report included limited consultation with many communities or constituencies discussed herein, including Indigenous, Latinx, and Asian/Pacific Islander communities and organizations. Greenpeace USA commits to pursue additional efforts to analyze and uplift the impacts and role of fossil fuel racism on Indigenous peoples and Tribal nations, as well as on other communities.
This report is a project of Greenpeace, Inc., a registered Internal Revenue Service 501(c)(4) non-profit entity.
Greenpeace USA is grateful to the more than 20 organizations that endorsed this report, and for their continued action in defense of a stable climate and more just and peaceful world.
350.org
Action Center on Race and the Economy
Alliance of Nurses for Healthy Environments
Anti Police-Terror Project
Center for Biological Diversity
Central California Environmental Justice Network
Communities for a Better Environment
Earthworks
Friends of the Earth US
Grassroots Global Justice Alliance
GreenFaith
Idle No More SF Bay
Indivisible
Kentuckians For The Commonwealth
Mothers Out Front
Movement Generation Justice & Ecology Project
National Hispanic Medical Association
Oil Change International
Our Climate
Peoples Action
The People’s Justice Council
Rainforest Action Network
RISE St. James
STAND-LA Coalition
Sunrise Movement
Working Families Party
Endnotes
[1] Farrow, A., Miller, K.A. & Myllyvirta, L. 2020. Toxic air: The price of fossil fuels. Greenpeace Southeast Asia & Centre for Research on Energy and Clean Air. February. https://www.greenpeace.org/usa/wp-content/uploads/2020/02/The-Price-of-Fossil-Fuels-full-report.pdf
[2] Vohra et al. 2021. Global mortality from outdoor fine particle pollution generated by fossil fuel combustion: Results from GEOS-Chem. Env. Research, 195, 110754. https://www.sciencedirect.com/science/article/abs/pii/S0013935121000487
[3] Mikati et al. 2018. Disparities in Distribution of Particulate Matter Emission Sources by Race and Poverty Status. American Journal of Public Health, 108, 480-485. http://ajph.aphapublications.org/doi/pdf/10.2105/AJPH.2017.304297
[4] Richmond-Bryant et al. 2020. Disparities in Distribution of Particulate Matter Emissions from US Coal-Fired Power Plants by Race and Poverty Status After Accounting for Reductions in Operations Between 2015 and 2017. American Journal of Public Health, 110, 655-661. https://ajph.aphapublications.org/doi/abs/10.2105/AJPH.2019.305558
[5] Rowangould, G. 2013. A census of the US near-roadway population: Public health and environmental justice considerations. Transp. Res. D., 25, 59-67. https://www.sciencedirect.com/science/article/abs/pii/S1361920913001107
[6] Garcia-Gonzalez et al. 2019. Hazardous Air Pollutants Associated with Upstream Oil and Natural Gas Development: A Critical Synthesis of Current Peer-Reviewed Literature. Annual Review of Public Health, 40, 283-304. https://www.annualreviews.org/doi/10.1146/annurev-publhealth-040218-043715
[7] Czolowski et al. 2017. Toward consistent methodology to quantify populations in proximity to oil and gas development: A national spatial analysis and review. Environ Health Perspect, 125, 12, 124003. https://www.ncbi.nlm.nih.gov/pmc/articles/PMC5963578
[8] Fleischman & Franklin. 2017. Fumes Across the Fence-Line: The Health Impacts of Air Pollution from Oil & Gas Facilities on African American Communities. NAACP & Clean Air Task Force. https://www.naacp.org/climate-justice-resources/fumes-across-fence-line/
[9] Johnston et al. 2019. Impact of upstream oil extraction and environmental public health: A review of the evidence. Sci Total Environ, 20, 657, 187-199. https://pubmed.ncbi.nlm.nih.gov/30537580/
[10] Concerned Health Professionals of New York & Physicians for Social Responsibility. 2020. Compendium of scientific, medical, and media findings demonstrating risks and harms of fracking (unconventional gas and oil extraction) (7th ed.). http://concernedhealthny.org/compendium/
[11] Donaghy, T. 2021. Research Brief: Environmental Justice Across Industrial Sectors. Greenpeace USA, April. https://www.greenpeace.org/usa/research/environmental-justice-industrial-sectors/
[12] Zwickl, K. 2019. The demographics of fracking: A spatial analysis for four U.S. states. Ecological Economics, 161, 202-215. https://www.sciencedirect.com/science/article/abs/pii/S092180091830661X
[13] Bekkar et al. 2020. Association of Air Pollution and Heat Exposure With Preterm Birth, Low Birth Weight, and Stillbirth in the USA Systematic Review. JAMA Netw. Open., 3, 6, e208243. https://jamanetwork.com/journals/jamanetworkopen/fullarticle/2767260
[14] Hoffman et al. 2020. The Effects of Historical Housing Policies on Resident Exposure to Intra-Urban Heat: A Study of 108 US Urban Areas. Climate, 8, 1, 12. https://www.mdpi.com/2225-1154/8/1/12/htm
[15] Nardone et al. 2020. Associations between historical residential redlining and current age-adjusted rates of emergency department visits due to asthma across eight cities in California: an ecological study. Lancet, 4, 1, e24-e31. https://www.thelancet.com/journals/lanplh/article/PIIS2542-5196(19)30241-4/fulltext
[16] Johnston et al. 2016. Wastewater disposal wells, fracking, and environmental justice in southern Texas. American Journal of Public Health, 106, 3, 550-556. https://ajph.aphapublications.org/doi/full/10.2105/AJPH.2015.303000
[17] Johnston et al. 2020. Environmental justice dimensions of oil and gas flaring in South Texas: Disproportionate exposure among Hispanic communities. Environ. Sci. Technol., 54, 10, 6289–6298. https://pubs.acs.org/doi/10.1021/acs.est.0c00410
[18] Cushing et al. 2020. Flaring from Unconventional Oil and Gas Development and Birth Outcomes in the Eagle Ford Shale in South Texas. Env. Health. Pers., 128, 7. https://ehp.niehs.nih.gov/doi/10.1289/EHP6394
[19] Burr et al. 2018. The Oakville Oil Refinery Closure and Its Influence on Local Hospitalizations: A Natural Experiment on Sulfur Dioxide. Int. J. Environ. Res. Public Health, 15, 9, 2029. https://www.mdpi.com/1660-4601/15/9/2029
[20] Remy et al. 2019. Hospital, health, and community burden after oil refinery fires, Richmond, California 2007 and 2012. Env. Health, 18, 48. https://link.springer.com/article/10.1186/s12940-019-0484-4
[21] Casey et al. 2018. Retirements of Coal and Oil Power Plants in California: Association With Reduced Preterm Birth Among Populations Nearby. Am. J. Epidemiol. 187, 8, 1586–1594. https://academic.oup.com/aje/article/187/8/1586/4996680?rss%3D1
[22] Intergovernmental Panel on Climate Change (IPCC). 2018: Global Warming of 1.5°C. https://www.ipcc.ch/sr15/
[23] Union of Concerned Scientists. The Hidden Costs of Fossil Fuels. https://www.ucsusa.org/resources/hidden-costs-fossil-fuels
[24] Jefferson, N. & L. Stokes. 2020. Our racist fossil fuel energy system: The fossil fuel economy is killing Black Americans. Boston Globe, July 17. https://www.bostonglobe.com/2020/07/13/opinion/our-racist-fossil-fuel-energy-system/
[25] Bullard, R. 1990. Dumping in Dixie. Boulder, CO: Westview Press. https://books.google.com/books/about/Dumping_In_Dixie.html?id=Wh9qiXueaL0C
[26] United Church of Christ Commission for Racial Justice. 1987. Toxic Waste and Race in the United States. http://uccfiles.com/pdf/ToxicWastes&Race.pdf
[27] Bullard, R. & B. Wright. 1993. Environmental Justice for all: Community Perspectives on Health and Research. Tox. & Ind. Health, 9, 5, 821-841. https://journals.sagepub.com/doi/10.1177/074823379300900508
[28] Bullard et al. 2007. Toxic Wastes and Race at Twenty 1987—2007. UCC Justice & Witness Ministries. https://www.nrdc.org/sites/default/files/toxic-wastes-and-race-at-twenty-1987-2007.pdf
[29] The Biden Plan for a Clean Energy Revolution and Environmental Justice. https://joebiden.com/climate-plan/
[30] National Black Environmental Justice Network. Environmental Justice and Environmental Racism Statement. https://www.nbejn.com/environmental-justice-statement
[31] Latner, M. 2018. Building a Healthier Democracy: The Link between Voting Rights and Environmental Justice. Union of Concerned Scientists, August. https://www.ucsusa.org/resources/building-healthier-democracy
[32] Mapping Inequality: Redlining in New Deal America. https://dsl.richmond.edu/panorama/redlining/#loc=5/39.1/-94.58
[33] American Public Health Association. Racism and Health. https://www.apha.org/Topics-and-Issues/Health-Equity/Racism-and-health
[34] U.S. Health and Human Services. Office of Minority Health. Asthma and African Americans. https://minorityhealth.hhs.gov/omh/browse.aspx?lvl=4&lvlid=15
[35] Haudenosaunee Confederacy. Who We Are. https://www.haudenosauneeconfederacy.com/who-we-are/
[36] Drake Well Museum and Park. Site History. https://www.drakewell.org/about-us/site-history
[37] Johnston, J. & L. Cushing. 2020. Chemical Exposures, Health, and Environmental Justice in Communities Living on the Fenceline of Industry. Curr Envir Health Rpt, 7, 48–57. https://link.springer.com/article/10.1007/s40572-020-00263-8
[38] Banzhaf et al. 2019. Environmental Justice: The Economics of Race, Place, and Pollution. Journal of Economic Perspectives, 33, 1, 185-208. https://www.aeaweb.org/articles?id=10.1257/jep.33.1.185
[39] Pastor et al. 2005. The Air Is Always Cleaner on the Other Side: Race, Space, and Ambient Air Toxics Exposures in California. Journal of Urban Affairs, 27, 2, 127-148. https://www.tandfonline.com/doi/abs/10.1111/j.0735-2166.2005.00228.x
[40] Pastor, M. 2007. Environmental Justice: Reflections from the United States. In Boyce, Narain & Stanton, eds. Reclaiming Nature: Environmental Justice and Ecological Restoration. https://books.google.com/books?hl=en&lr=&id=yq41DgAAQBAJ
[41] White, R. 2018. Life At the Fenceline: Understanding Cumulative Health Hazards in Environmental Justice Communities. Environmental Justice Health Alliance for Chemical Policy Reform, Coming Clean, Campaign for Healthier Solutions, September. https://ej4all.org/life-at-the-fenceline
[42] O’Rourke & Connolly. 2003. Just Oil? The Distribution of Environmental and Social Impacts of Oil Production and Consumption. Annual Review of Environment and Resources, 28, 1, 587-617. https://www.annualreviews.org/doi/full/10.1146/annurev.energy.28.050302.105617
[43] Healy et al. 2019. Embodied energy injustices: Unveiling and politicizing the transboundary harms of fossil fuel extractivism and fossil fuel supply chains. Energy Research & Social Science, 48, 219-234. https://www.sciencedirect.com/science/article/pii/S2214629618306698
[44] Epstein et al. 2011. Full cost accounting for the life cycle of coal. Ann. N.Y. Acad. Sci., 1219, 73–98. http://www.coaltrainfacts.org/docs/epstein_full-cost-of-coal.pdf
[45] Temper et al. 2018. The Global Environmental Justice Atlas (EJAtlas): ecological distribution conflicts as forces for sustainability. Sustainability Science, 13, 573–584. https://link.springer.com/article/10.1007/s11625-018-0563-4
[46] Yergin. D. 2009. The Prize: The Epic Quest for Oil, Money & Power. New York, NY: Free Press. https://books.google.com/books/about/The_Prize.html?id=InfonQEACAAJ
[47] Juhasz, A. 2009. The Tyranny of Oil: The World’s Most Powerful Industry–and What We Must Do to Stop It. New York, NY: Harper Collins. https://books.google.com/books/about/The_Tyranny_of_Oil.html?id=YabTmAEACAAJ
[48] Klare, M. 2002. Resource Wars: The New Landscape of Global Conflict. New York, NY: Macmillan. https://books.google.com/books/about/Resource_Wars.html?id=IPW2KfEJNA8C
[49] Healy et al. 2019
[50] Watkins, P. 2021. Black Health in America: Exploring Racial Disparities in COVID-19 Vaccination Data. Data For Black Lives, February 25. https://blog.d4bl.org/racial-disparities-in-covid19-vaccination-data/
[51] Amiri et al. 2021. Unmasking the Influence of Air Pollution, Health Disparities, and Oil and Gas Development on COVID-19. Alliance of Nurses for Healthy Environments, January. https://envirn.org/wp-content/uploads/2021/01/COVIDFossilFuels_Final.pdf
[52] Ketyer, E. & L. McKenzie. 2021. Air Pollution and Covid-19: A Dangerous Combination. Physicians for Social Responsibility, January. https://www.psr.org/wp-content/uploads/2021/01/air-pollution-and-covid-19.pdf
[53] Wu et al. 2020. Exposure to air pollution and COVID-19 mortality in the United States: A nationwide cross-sectional study. Science Advances, 6, 45. https://advances.sciencemag.org/content/6/45/eabd4049
[54] Nemeth, J. & S. Rowan. 2020. Is your neighborhood raising your coronavirus risk? Redlining decades ago set communities up for greater danger. The Conversation, May 26. https://theconversation.com/is-your-neighborhood-raising-your-coronavirus-risk-redlining-decades-ago-set-communities-up-for-greater-danger-138256
[55] U.S. EPA. Criteria Air Pollutants. https://www.epa.gov/criteria-air-pollutants
[56] U.S. EPA. Particulate Matter (PM) Pollution. https://www.epa.gov/pm-pollution
[57] U.S. EPA. Nitrogen Dioxide (NO2) Pollution. https://www.epa.gov/no2-pollution
[58] U.S. EPA. Sulfur Dioxide (SO2) Pollution. https://www.epa.gov/so2-pollution
[59] U.S. EPA. Ground-level Ozone Pollution. https://www.epa.gov/ground-level-ozone-pollution
[60] Rasmussen et al. 2013. The ozone–climate penalty: Past, present, and future. Environmental Science & Technology, 47, 24, 14258–14266. https://pubs.acs.org/doi/10.1021/es403446m
[61] U.S. EPA. Carbon Monoxide (CO) Pollution in Outdoor Air. https://www.epa.gov/co-pollution
[62] U.S. EPA. Lead (Pb) Air Pollution. https://www.epa.gov/lead-air-pollution
[63] U.S. EPA. Hazardous Air Pollutants. https://www.epa.gov/haps
[64] Garcia-Gonzalez et al. 2019
[65] Dalsøren et al. 2018. Discrepancy between simulated and observed ethane and propane levels explained by underestimated fossil emissions. Nature Geoscience, 11, 178–184. https://www.nature.com/articles/s41561-018-0073-0
[66] Rajabi et al. 2020. Emissions of volatile organic compounds from crude oil processing – Global emission inventory and environmental release. Sci Total Environ, 727, 20, 138654. https://www.sciencedirect.com/science/article/pii/S0048969720321707
[67] Earthworks. Hydrogen Sulfide. https://www.earthworks.org/issues/hydrogen_sulfide/
[68] U.S. EPA. Toxics Release Inventory (TRI) Program. https://www.epa.gov/toxics-release-inventory-tri-program
[69] U.S. EPA. Risk-Screening Environmental Indicators (RSEI) Model. https://www.epa.gov/rsei
[70] U.S. EPA. National Air Toxics Assessment. https://www.epa.gov/national-air-toxics-assessment
[71] U.S. EPA. EJSCREEN: Environmental Justice Screening and Mapping Tool. https://www.epa.gov/ejscreen
[72] Belluz, J. & S. Hoffman. 2015. The one chart you need to understand any health study. Vox, January 5. https://www.vox.com/2015/1/5/7482871/types-of-study-design
[73] Collins et al. 2016. Linking ‘toxic outliers’ to environmental justice communities. Environ. Res. Lett.,11, 015004. https://iopscience.iop.org/article/10.1088/1748-9326/11/1/015004/pdf
[74] U.S. EPA. The NRC Risk Assessment Paradigm. https://www.epa.gov/fera/nrc-risk-assessment-paradigm
[75] U.S. EPA. Integrated Science Assessments (ISAs). https://www.epa.gov/isa
[76] U.S. EPA Science Advisory Board. 2008. Benefits of Reducing Benzene Emissions in Houston, 1990–2020. EPA-COUNCIL-08-001. https://yosemite.epa.gov/sab/sabproduct.nsf/D4D7EC9DAEDA8A548525748600728A83/$File/EPA-COUNCIL-08-001-unsigned.pdf
[77] Clough, E. & D. Bell. 2016. Just fracking: a distributive environmental justice analysis of unconventional gas development in Pennsylvania, USA. Environ. Res. Lett., 11, 025001. https://iopscience.iop.org/article/10.1088/1748-9326/11/2/025001
[78] Mohai, P. & R. Saha. 2015. Which came first, people or pollution? A review of theory and evidence from longitudinal environmental justice studies. Environ. Res. Lett., 10, 125011. https://iopscience.iop.org/article/10.1088/1748-9326/10/12/125011/meta
[79] Michaels, D. 2020. The Triumph of Doubt: Dark Money and the Science of Deception.
[80] Carter et al. 2019. The State of Science in the Trump Era: Damage Done, Lessons Learned, and a Path to Progress. Union of Concerned Scientists, January. https://www.ucsusa.org/resources/state-science-trump-era
[81] Frey, H.C. 2020. EPA decides to reject the latest science, endanger public health and ignore the law by keeping an outdated fine particle air pollution standard. The Conversation, May 1. https://theconversation.com/epa-decides-to-reject-the-latest-science-endanger-public-health-and-ignore-the-law-by-keeping-an-outdated-fine-particle-air-pollution-standard-136226
[82] IPCC 1.5
[83] SEI, IISD, ODI, E3G, and UNEP. 2020. The Production Gap Report: 2020 Special Report. https://productiongap.org/2020report/
[84] Muttitt, G. 2016. The Sky’s Limit: Why The Paris Climate Goals Require a Managed Decline of Fossil Fuel Production. Oil Change International. September. http://priceofoil.org/content/uploads/2016/09/OCI_the_skys_limit_2016_FINAL_2.pdf
[85] Erickson et al. 2018. Limiting fossil fuel production as the next big step in climate policy. Nature Climate Change, 8, 12, 1037-1043. https://www.nature.com/articles/s41558-018-0337-0
[86] Donaghy, T. 2019. Real Climate Leadership: Why The Next President Must Prioritize A Fossil Fuel Phase Out. Greenpeace USA, June. https://www.greenpeace.org/usa/reports/fossil-fuel-phaseout/
[87] Muttitt, G. & S. Kartha. 2020. Equity, climate justice and fossil fuel extraction: principles for a managed phase out. Climate Policy, 20, 8, 1024-1042. https://www.tandfonline.com/doi/full/10.1080/14693062.2020.1763900
[88] Cohen et al. 2017. Estimates and 25-year trends of the global burden of disease attributable to ambient air pollution: an analysis of data from the Global Burden of Diseases Study 2015. Lancet, 389, 10082, 1907-1918. https://www.thelancet.com/journals/lancet/article/PIIS0140-6736(17)30505-6/fulltext
[89] Academy of Science of South Africa, et al. 2019. Air Pollution and Health – A Science-Policy Initiative. Annals of Global Health, 85, 1,140. https://annalsofglobalhealth.org/articles/10.5334/aogh.2656/
[90] Zhang et al. 2018. Long-term trends in the ambient PM2.5- and O3-related mortality burdens in the United States under emission reductions from 1990 to 2010. Atmos. Chem. Phys, 18, 15003–15016. https://acp.copernicus.org/articles/18/15003/2018/
[91] Di et al. 2017. Air Pollution and Mortality in the Entire Medicare Population. N Engl J Med, 376, 2513-2522. https://www.nejm.org/doi/full/10.1056/nejmoa1702747
[92] Perera, F. 2018. Pollution from Fossil-Fuel Combustion is the Leading Environmental Threat to Global Pediatric Health and Equity: Solutions Exist. Int J Environ Res Public Health, 15, 1, 16. https://www.ncbi.nlm.nih.gov/pmc/articles/PMC5800116/
[93] Goodkind et al. 2019. Fine-scale damage estimates of particulate matter air pollution reveal opportunities for location-specific mitigation of emissions. PNAS, 116, 18, 8775-8780. https://www.pnas.org/content/pnas/116/18/8775.full.pdf
[94] Shindell, D. & C.J. Smith. 2019. Climate and air-quality benefits of a realistic phase-out of fossil fuels. Nature, 573, 408–411. https://www.nature.com/articles/s41586-019-1554-z
[95] Lelieveld et al. 2019. Effects of fossil fuel and total anthropogenic emission removal on public health and climate. PNAS, 116 15, 7192-7197. https://www.pnas.org/content/116/15/7192
[96] Rao et al. 2016. A multi-model assessment of the co-benefits of climate mitigation for global air quality. Environ. Res. Lett., 11, 124013. https://iopscience.iop.org/article/10.1088/1748-9326/11/12/124013
[97] Van Dyck et al. 2018. Air quality co-benefits for human health and agriculture counterbalance costs to meet Paris Agreement pledges. Nature Communications, 9, 4939. https://www.nature.com/articles/s41467-018-06885-9
[98] Markandya et al. 2018. Health co-benefits from air pollution and mitigation costs of the Paris Agreement: a modelling study. Lancet Planetary Health, 2, 3, e126-e133. http://www.thelancet.com/journals/lanpla/article/PIIS2542-5196(18)30029-9/fulltext
[99] Wang et al. 2020. Health co-benefits of achieving sustainable net-zero greenhouse gas emissions in California. Nature Sustainability, 3, 597–605. https://www.nature.com/articles/s41893-020-0520-y
[100] California Environmental Justice Alliance. 2017. Environmental Justice Issues in California’s Cap and Trade System. https://caleja.org/wp-content/uploads/2017/04/EJissuesinCAcapandtrade.pdf
[101] Shonkoff et al. 2011. The climate gap: environmental health and equity implications of climate change and mitigation policies in California—a review of the literature. Climatic Change, 109, 485–503. https://link.springer.com/article/10.1007/s10584-011-0310-7
[102] Cushing et al. 2018. Carbon trading, co-pollutants, and environmental equity: Evidence from California’s cap-and-trade program (2011–2015). PLOS Medicine, 15, 7, e1002604. https://journals.plos.org/plosmedicine/article?id=10.1371/journal.pmed.1002604
[103] Johnson, N. 2020. Cap and Trade-Offs: Did California’s landmark legislation help or hurt the state’s most vulnerable? Grist, October 19. https://grist.org/climate/the-biggest-fight-over-cap-and-trade-isnt-about-what-you-think-it-is/
[104] Diana, B., M. Ash & J. Boyce. 2021. Green for All: Integrating Air Quality and Environmental Justice into the Clean Energy Transition. Political Economy Research Institute, March. https://www.peri.umass.edu/publication/item/1408-green-for-all-integrating-air-quality-and-environmental-justice-into-the-clean-energy-transition
[105] Gupte, E. & P. VanLaningham. 2021. US’ Occidental supplies first cargo of ‘carbon-neutral crude’ to India’s Reliance. Platts, January 29. https://www.spglobal.com/platts/en/market-insights/latest-news/oil/012921-us-occidental-supplies-first-cargo-of-carbon-neutral-crude-to-indias-reliance
[106] European Environment Agency. 2011. Air pollution impacts from carbon capture and storage (CCS). Technical report No 14/2011. https://www.eea.europa.eu/publications/carbon-capture-and-storage
[107] Jacobson, M. 2019. The health and climate impacts of carbon capture and direct air capture. Energy Environ. Sci., 12, 3567. https://web.stanford.edu/group/efmh/jacobson/Articles/Others/19-CCS-DAC.pdf
[108] Curry, M. 2021. Environmental Justice Members Resign from CARB Task Force on Carbon Offsets. Streetsblog Cal, February 11. https://cal.streetsblog.org/2021/02/11/environmental-justice-members-resign-from-carb-task-force-on-carbon-offsets/
[109] Song, L. 2019. An Even More Inconvenient Truth: Why Carbon Credits For Forest Preservation May Be Worse Than Nothing. ProPublica, May 22. https://features.propublica.org/brazil-carbon-offsets/inconvenient-truth-carbon-credits-dont-work-deforestation-redd-acre-cambodia/
[110] American Petroleum Institute. 2021. API Outlines Path for Low-Carbon Future in New Climate Action Framework. March. https://www.api.org/news-policy-and-issues/news/2021/03/24/climate-action-framework
[111] Roberts, D. 2020. At last, a climate policy platform that can unite the left. Vox, July 9. https://www.vox.com/energy-and-environment/21252892/climate-change-democrats-joe-biden-renewable-energy-unions-environmental-justice
[112] Center for International Environmental Law. Smoke and Fumes. https://www.smokeandfumes.org/fumes
[113] Supran, G. & N. Oreskes. 2017. Assessing ExxonMobil’s climate change communications (1977–2014). Environ. Res. Lett., 12, 084019. https://iopscience.iop.org/article/10.1088/1748-9326/aa815f
[114] Exxon Secrets. ExxonMobil Climate Denial Funding 1998-2014. https://exxonsecrets.org/
[115] Milman, O. 2021. Oil firms knew decades ago fossil fuels posed grave health risks, files reveal. The Guardian, March 18. https://www.theguardian.com/environment/2021/mar/18/oil-industry-fossil-fuels-air-pollution-documents
[116] Czolowski et al. 2017
[117] U.S. Energy Information Administration. Frequently Asked Questions (FAQS). https://www.eia.gov/tools/faqs/faq.php?id=907&t=8; https://www.eia.gov/tools/faqs/faq.php?id=847&t=6
[118] PSE Healthy Energy. ROGER Citation Database. https://www.psehealthyenergy.org/our-work/shale-gas-research-library/
[119] Shonkoff, S. & L.A. Hill. 2019. Human health and oil and gas development: A review of the peer-reviewed literature and assessment of applicability to the City of Los Angeles. PSE Healthy Energy, August. https://www.psehealthyenergy.org/wp-content/uploads/2019/08/Literature-Review.pdf
[120] Compendium v7.0
[121] Long et al. 2015. An Independent Scientific Assessment of Well Stimulation in California, Summary Report: An Examination of Hydraulic Fracturing and Acid Stimulations in the Oil and Gas Industry. California Council on Science and Technology (CCST), July. https://ccst.us/reports/well-stimulation-in-california/
[122] Wong, N. 2017. Existing scientific literature on setback distances from oil and gas development sites. STAND-LA. https://www.stand.la/uploads/5/3/9/0/53904099/2500_literature_review_report-v2-share.pdf
[123] Johnston et al. 2019
[124] Schade, G. 2017. How has the US fracking boom affected air pollution in shale areas? The Conversation, November 2. https://theconversation.com/how-has-the-us-fracking-boom-affected-air-pollution-in-shale-areas-66190
[125] Allred et al. 2015. Ecosystem services lost to oil and gas in North America. Science, 348, 6233, 401-402. https://science.sciencemag.org/content/348/6233/401
[126] Ridlington, E., K. Norman & R. Richardson. 2016. Fracking by the Numbers: The Damage to Our Water, Land and Climate from a Decade of Dirty Drilling. April, Environment America & Frontier Group. http://www.environmentamerica.org/sites/environment/files/reports/Fracking%20by%20the%20Numbers%20vUS.pdf
[127] U.S. EPA. Understanding Global Warming Potentials. https://www.epa.gov/ghgemissions/understanding-global-warming-potentials
[128] Alvarez et al. 2018. Assessment of methane emissions from the U.S. oil and gas supply chain. Science, 361, 6398, 186-188. https://science.sciencemag.org/content/361/6398/186
[129] Sarofim et al. 2017. Valuing the ozone-related health benefits of methane emission controls. Environ Resource Econ, 66, 45–63. https://link.springer.com/content/pdf/10.1007/s10640-015-9937-6.pdf
[130] Shindell et al. 2017. The social cost of methane: Theory and applications. Faraday Discuss., 200, 429-451. https://pubs.rsc.org/en/content/articlelanding/fd/2017/c7fd00009j#!divAbstract
[131] Garcia-Gonzalez et al. 2019
[132] Bolden et al. 2018. Exploring the endocrine activity of air pollutants associated with unconventional oil and gas extraction. Environmental Health, 17, 26. https://ehjournal.biomedcentral.com/articles/10.1186/s12940-018-0368-z
[133] Carter, L. & T. Donaghy. 2019. Exxon and BP among worst for flaring in US oil fields despite green pledges. Unearthed, October 17. https://unearthed.greenpeace.org/2019/10/17/exxon-bp-flaring-united-states-climate-change/
[134] Dix et al. 2019. Nitrogen Oxide Emissions from U.S. Oil and Gas Production: Recent Trends and Source Attribution. Geophysical Res. Lett., 47, e2019GL085866. https://agupubs.onlinelibrary.wiley.com/doi/abs/10.1029/2019GL085866
[135] Macey et al. 2014. Air concentrations of volatile compounds near oil and gas production: a community-based exploratory study. Environmental Health, 13, 82. https://ehjournal.biomedcentral.com/articles/10.1186/1476-069X-13-82
[136] Garcia-Gonzalez et al. 2019b. Distance decay gradients in hazardous air pollution concentrations around oil and natural gas facilities in the city of Los Angeles: A pilot study. Env. Research, 173, 232-236. https://www.sciencedirect.com/science/article/abs/pii/S0013935119301550
[137] Paulik et al. 2018. Environmental and individual PAH exposures near rural natural gas extraction. Env. Pollution, 241, 397-405. https://www.sciencedirect.com/science/article/pii/S0269749117347176
[138] Cushing et al. 2021. Up in smoke: characterizing the population exposed to flaring from unconventional oil and gas development in the contiguous US. Environ. Res. Lett., 16, 034032. https://iopscience.iop.org/article/10.1088/1748-9326/abd3d4
[139] Buonocore et al. 2021. Air Quality and Health Benefits of Methane Policies in the United States Oil & Gas Sector. Under review.
[140] Finkel, M. 2016. Shale gas development and cancer incidence in southwest Pennsylvania. Public Health, 141, 198-206. https://www.sciencedirect.com/science/article/abs/pii/S0033350616302396
[141] McKenzie et al. 2017. Childhood hematologic cancer and residential proximity to oil and gas development. PLoS One, 12, 2, e0170423 https://journals.plos.org/plosone/article?id=10.1371/journal.pone.0170423
[142] McMullin et al. 2018. Exposures and Health Risks from Volatile Organic Compounds in Communities Located near Oil and Gas Exploration and Production Activities in Colorado (U.S.A.). Int. J. Environ. Res. Public Health, 15, 7, 1500. https://www.mdpi.com/1660-4601/15/7/1500
[143] McKenzie et al. 2018. Ambient Nonmethane Hydrocarbon Levels Along Colorado’s Northern Front Range: Acute and Chronic Health Risks. Environ Sci Technol., 52, 8, 4514-4525. https://pubmed.ncbi.nlm.nih.gov/29584423/
[144] McKenzie et al. 2012. Human Health Risk Assessment of Air Emissions From Development of Unconventional Natural Gas Resources. Sci Total Environ, 424, 79-87. https://pubmed.ncbi.nlm.nih.gov/22444058/
[145] Gonzalez et al. 2020. Oil and gas production and spontaneous preterm birth in the San Joaquin Valley, CA: A case–control study. Environmental Epidemiology, 4, 4, e099. https://journals.lww.com/environepidem/Fulltext/2020/08000/Oil_and_gas_production_and_spontaneous_preterm.1.aspx
[146] Tran et al. 2020. Residential Proximity to Oil and Gas Development and Birth Outcomes in California: A Retrospective Cohort Study of 2006–2015 Births. Env. Health. Pers., 128, 6. https://ehp.niehs.nih.gov/doi/full/10.1289/EHP5842
[147] Cushing et al. 2020
[148] McKenzie et al. 2014. Birth Outcomes and Maternal Residential Proximity to Natural Gas Development in Rural Colorado. Env. Health. Pers., 122, 4. https://ehp.niehs.nih.gov/doi/10.1289/ehp.1306722
[149] Currie et al. 2017. Hydraulic fracturing and infant health: New evidence from Pennsylvania. Science Advances, 3, 12, e1603021. https://advances.sciencemag.org/content/3/12/e1603021
[150] Apergis et al. 2019. Fracking and infant mortality: fresh evidence from Oklahoma. Environmental Science and Pollution Research, 26, 32360–32367. https://link.springer.com/article/10.1007/s11356-019-06478-z
[151] Cheadle et al. 2017. Surface ozone in the Colorado northern Front Range and the influence of oil and gas development during FRAPPE/DISCOVER-AQ in summer 2014. Elementa, 5, 61. https://online.ucpress.edu/elementa/article/doi/10.1525/elementa.254/112466/Surface-ozone-in-the-Colorado-northern-Front-Range
[152] Pozzer et al. 2020. Impact of U.S. Oil and Natural Gas Emission Increases on Surface Ozone Is Most Pronounced in the Central United States. Environ. Sci. Technol., 54, 19, 12423–12433. https://pubs.acs.org/doi/10.1021/acs.est.9b06983
[153] Li et al. 2019. Effects of ambient ozone concentrations with different averaging times on asthma exacerbations: A meta-analysis. Sci. Tot. Environ, 691, 549-561. https://www.sciencedirect.com/science/article/abs/pii/S0048969719329559
[154] Shamasunder et al. 2018. Community-Based Health and Exposure Study around Urban Oil Developments in South Los Angeles. Int. J. Environ. Res. Public Health, 15, 1, 138. https://www.mdpi.com/1660-4601/15/1/138
[155] Rasmussen et al. 2016. Association Between Unconventional Natural Gas Development in the Marcellus Shale and Asthma Exacerbations. JAMA Intern. Med., 176, 9, 1334-1343 https://jamanetwork.com/journals/jamainternalmedicine/article-abstract/2534153
[156] Willis et al. 2018. Unconventional natural gas development and pediatric asthma hospitalizations in Pennsylvania. Env. Research, 166, 402-408. https://www.sciencedirect.com/science/article/abs/pii/S001393511830183X
[157] McAlexander et al. 2020. Unconventional Natural Gas Development and Hospitalization for Heart Failure in Pennsylvania. J Am Coll Cardiol., 76, 24, 2862-2874. https://pubmed.ncbi.nlm.nih.gov/33303076/
[158] McKenzie et al. 2018. Relationships between Indicators of Cardiovascular Disease and Intensity of Oil and Natural Gas Activity in Northeastern Colorado. Environ Res., 170, 56–64. https://www.ncbi.nlm.nih.gov/pmc/articles/PMC6360130/
[159] Apergis et al. 2021. An analysis of the impact of unconventional oil and gas activities on public health: New evidence across Oklahoma counties. Energy Economics, 97, 105223. https://www.sciencedirect.com/science/article/pii/S0140988321001286
[160] Compendium v7.0
[161] Compendium v7.0
[162] Kroepsch et al. 2019. Environmental justice in unconventional oil and natural gas drilling and production: A critical review and research agenda. Environ. Sci. Technol., 53, 12, 6601–6615. https://pubs.acs.org/doi/10.1021/acs.est.9b00209
[163] Clough. 2018. Environmental justice and fracking: A review. Current Opinion in Environmental Science & Health, 3, 14-18. https://www.sciencedirect.com/science/article/abs/pii/S2468584417300478
[164] Johnston et al. 2016
[165] Bienkowski, B. 2016. Fracking’s Costs Fall Disproportionately on the Poor and Minorities in South Texas. Environmental Health News, February 17. https://insideclimatenews.org/news/17022016/poor-minorities-carry-burden-fracking-waste-south-texas-eagle-ford-shale/
[166] Johnston et al. 2020
[167] Cushing et al. 2020 ; see also Johnston & Cushing. 2020. The Risk of Preterm Birth Rises Near Gas Flaring, Reflecting Deep-rooted Environmental Injustices in Rural America. DesmogBlog, August 20. https://www.desmogblog.com/2020/08/20/preterm-birth-gas-flaring-eagle-ford-shale-injustices
[168] Cushing et al. 2021
[169] Clough & Bell 2016
[170] Ogneva-Himmelberger & Huang. 2015. Spatial distribution of unconventional gas wells and human populations in the Marcellus Shale in the United States: Vulnerability analysis. Applied Geography, 60, 165-174. https://www.sciencedirect.com/science/article/abs/pii/S0143622815000776
[171] Srebotnjak & Rotkin-Ellman. 2014. Drilling in California: Who’s at risk? NRDC, October. https://www.nrdc.org/sites/default/files/california-fracking-risks-report.pdf
[172] Ferrar, K. 2020. People and Production: Reducing Risk in California Extraction. FracTracker Alliance, December 17. https://www.fractracker.org/2020/12/people-and-production/
[173] Ferrar, K. 2020. Systematic Racism in Kern County Oil and Gas Permitting Ordinance. FracTracker Alliance, June 8. https://www.fractracker.org/2020/06/systematic-racism-in-kern-county-oil-and-gas-permitting-ordinance/
[174] Liberty Hill Foundation. 2015. The Community Consequences of Expanded Oil Development in Los Angeles. https://www.libertyhill.org/sites/default/files/Drilling%20Down%20Report%20-%20Full.pdf
[175] Cumming, D. 2018. Black Gold, White Power: Mapping Oil, Real Estate, and Racial Segregation in the Los Angeles Basin, 1900-1939. Engaging Science, Technology, and Society, 4, 85-110. https://estsjournal.org/article/view/212
[176] Zwickl 2019
[177] Fry et al. 2015. Fracking and environmental (in)justice in a Texas city. Ecological Economics. 117, 97-107. https://www.sciencedirect.com/science/article/abs/pii/S0921800915002438?via%3Dihub
[178] McKenzie et al. 2016. Population Size, Growth, and Environmental Justice Near Oil and Gas Wells in Colorado. Environ. Sci. Technol., 50, 21, 11471–11480. https://pubs.acs.org/doi/abs/10.1021/acs.est.6b04391
[179] Native Women’s Wilderness. Murdered & Missing Indigenous Women. https://www.nativewomenswilderness.org/mmiw
[180] The Firelight Group with Lake Babine Nation and Nak’azdli Whut’en. 2017. Indigenous Communities and Industrial Camps: Promoting Healthy Communities in Settings of Industrial Change. https://firelight.ca/wp-content/uploads/2016/03/Firelight-work-camps-Feb-8-2017_FINAL.pdf
[181] Skylar Joseph, A. 2021. A Modern Trail of Tears: The Missing and Murdered Indigenous Women (MMIW) Crisis in the US. J. Forensic & Legal Med., 79, 102136. https://www.sciencedirect.com/science/article/abs/pii/S1752928X21000214
[182] Wei-Haas, M. 2017. Why Black Lung Disease Is Deadlier Than Ever Before. Smithsonian, May 15. https://www.smithsonianmag.com/science-nature/black-lung-disease-deadlier-than-ever-before-180963303/
[183] National Institute for Occupational Safety and Health. 2018. Prevalence of Black Lung Continues to Increase among U.S. Coal Miners. July 20. https://www.cdc.gov/niosh/updates/upd-07-20-18.html
[184] See discussion and references in Epstein et al. 2011.
[185] Ockerman, E. 2017. African Americans in Appalachia fight to be seen as a part of coal country. Washington Post, August 10. https://www.washingtonpost.com/news/post-nation/wp/2017/08/10/african-americans-in-appalachia-fight-to-be-seen-as-a-part-of-coal-country/
[186] Appalachian Regional Commission. Poverty Rates in Appalachia, 2013–2017. https://www.arc.gov/map/poverty-rates-in-appalachia-2013-2017/; County Economic Status in Appalachia, FY 2019. https://www.arc.gov/map/county-economic-status-in-appalachia-fy-2019/
[187] Hendryx, M. 2010. Poverty and Mortality Disparities in Central Appalachia: Mountaintop Mining and Environmental Justice. J. Health Disp. Res. & Prac., 4, 3, 6. https://digitalscholarship.unlv.edu/jhdrp/vol4/iss3/6
[188] Lobao et al. 2016. Poverty, Place, and Coal Employment across Appalachia and the United States in a New Economic Era. Rural Sociology, 81, 3, 343-386. https://onlinelibrary.wiley.com/doi/abs/10.1111/ruso.12098
[189] U.S. EIA. 2019. Sixteen mines in the Powder River Basin produce 43% of U.S. coal. Today in Energy, August 26. https://www.eia.gov/todayinenergy/detail.php?id=41053
[190] U.S. Census Bureau. 2019 population estimates for Campbell, Converse, Johnson, Weston and Sheridan counties in Wyoming, and Big Horn, Rosebud County and Powder River counties in Montana. https://www.census.gov/data/tables/time-series/demo/popest/2010s-counties-detail.html
[191] Allison, J. 2012. From Survival to Sovereignty: 1970s Energy Development and Indian Self-Determination in Montana’s Powder River Basin. Environmental Justice, 5, 5, 252-263. https://www.liebertpub.com/doi/10.1089/env.2011.0032
[192] Chan, C. 2017. Coal War. Reuters, August 21. http://fingfx.thomsonreuters.com/gfx/rngs/USA-TRUMP-TRIBES/010050FH10J/index.html
[193] Hazardous Substance Research Centers/South & Southwest Outreach Program. 2003. Environmental Impact of the Petroleum Industry. https://cfpub.epa.gov/ncer_abstracts/index.cfm/fuseaction/display.files/fileID/14522
[194] Ragothaman & Anderson. 2017. Air Quality Impacts of Petroleum Refining and Petrochemical Industries. Environments, 4, 3, 66. https://www.mdpi.com/2076-3298/4/3/66/htm
[195] U.S. EPA. EasyRSEI Dashboard. https://edap.epa.gov/public/extensions/EasyRSEI/EasyRSEI.html
[196] Ash et al. 2009. Justice in the Air: Tracking Toxic Pollution from America’s Industries and Companies to our States, Cities, and Neighborhoods. Political Economy Research Institute (PERI). http://www.peri.umass.edu/fileadmin/pdf/dpe/ctip/justice_in_the_air.pdf
[197] Ash & Boyce. 2011. Measuring corporate environmental justice performance. Corporate Social Responsibility and Environmental Management, 18, 2, 61-79. https://onlinelibrary.wiley.com/doi/abs/10.1002/csr.238
[198] Donaghy 2021
[199] Fleischman & Franklin 2017
[200] Barbone et al. 2019. A Panel Study on Lung Function and Bronchial Inflammation among Children Exposed to Ambient SO2 from an Oil Refinery. Int J Environ Res Public Health, 16, 6, 1057. https://www.ncbi.nlm.nih.gov/pmc/articles/PMC6466338/
[201] Alwahaibi & Zeka. 2015. Respiratory and allergic health effects in a young population in proximity of a major industrial park in Oman. J Epidemiol Community Health, 70, 2, 174–180. https://www.ncbi.nlm.nih.gov/pmc/articles/PMC4752616/
[202] Yuan et al. 2018. Increased cancers among residents living in the neighborhood of a petrochemical complex: A 12-year retrospective cohort study. Int J Hyg Environ Health, 221, 2, 308-314. https://pubmed.ncbi.nlm.nih.gov/29287935/
[203] Lin et al. 2017. Lung cancer mortality of residents living near petrochemical industrial complexes: a meta-analysis. Environ Health, 16, 101. https://www.ncbi.nlm.nih.gov/pmc/articles/PMC5615452/
[204] Domingo et al. 2020. Health risks for the population living near petrochemical industrial complexes. 1. Cancer risks: A review of the scientific literature. Env. Research, 186, 109495. https://www.sciencedirect.com/science/article/abs/pii/S0013935120303881
[205] Chang et al. 2020. Incidence of Respiratory Symptoms for Residents Living Near a Petrochemical Industrial Complex: A Meta-Analysis. Int J Environ Res Public Health, 17, 7, 2474. https://www.ncbi.nlm.nih.gov/pmc/articles/PMC7178237/
[206] Marqués et al. 2020. Health risks for the population living near petrochemical industrial complexes. 2. Adverse health outcomes other than cancer. Sci. Tot. Environ, 730, 139122. https://www.sciencedirect.com/science/article/abs/pii/S0048969720326395
[207] Burr et al. 2018
[208] Levin et al. 2016. Breakdowns in Air Quality: Air Pollution from Industrial Malfunctions and Maintenance in Texas. Environmental Integrity Project & Environment Texas. https://environmentalintegrity.org/reports/breakdowns-in-air-quality/
[209] Louisiana Bucket Brigade. Refinery Accident Database. https://labucketbrigade.org/pollution-tools-resources/refinery-accident-database/
[210] D’Andrea & Reddy. 2016. Detrimental Health Effects of Benzene Exposure in Adults After a Flaring Disaster at the BP Refinery Plant in Texas City. Disaster Med Public Health Prep., 10, 2, 233-239. https://doi.org/10.1017/dmp.2015.160
[211] D’Andrea & Reddy. 2017. Adverse Health Complaints of Adults Exposed to Benzene After a Flaring Disaster at the BP Refinery Facility in Texas City, Texas. Disaster Med Public Health Prep., 12, 2, 232-240. https://doi.org/10.1017/dmp.2017.59
[212] Remy et al. 2019
[213] Malewitz, J. & J. McCollough. 2015. Blood Lessons: Ten years after a fiery explosion killed 15 in Texas City, preventable deaths continue at refineries. Texas Tribune, March 22. https://apps.texastribune.org/blood-lessons/
[214] McQuiston et al. 2013. A Risk Too Great: Hydrofluoric Acid in U.S. Refineries. Tony Mazzochi Center, New Perspectives Consulting Group, United Steelworkers. http://assets.usw.org/resources/hse/pdf/A-Risk-Too-Great.pdf
[215] Buhl, L. 2018. Activists and Oil Refiners Square Off Over Hydrofluoric Acid. Undark, October 10. https://undark.org/2018/10/10/hydrofluoric-acid-oil-refining-explosion/
[216] Sierra Club. 2020. Houston Community Continues Fight Against Valero For Polluting Air With Hydrogen Cyanide. August 28. https://www.sierraclub.org/texas/blog/2020/08/houston-community-continues-fight-against-valero-for-polluting-air-hydrogen
[217] Kunstman et al. 2020. Monitoring for Benzene at Refinery Fencelines: 10 Oil Refineries Across U.S. Emitted Cancer-Causing Benzene Above EPA Action Level. Environmental Integrity Project, February. https://environmentalintegrity.org/news/refineries-emit-benzene-in-amounts-above-epa-action-levels/
[218] McLaughlin et al. 2020. Special Report: U.S. air monitors routinely miss pollution – even refinery explosions. Reuters, December 1. https://www.reuters.com/article/idUSL1N2IG21I
[219] Fleischman & Franklin 2017.
[220] Auchincloss et al. 2019. Statement on the Health Effects of Refineries and Implications for the S Philadelphia Refinery. https://www.phila.gov/media/20191204161537/Auchincloss-et-al-Statement-on-the-Health-Effects-of-Refineries-and-Implications-for-S-Phila-Refinery.pdf
[221] Fleischman et al. 2016. Fossil Fumes: A public health analysis of toxic air pollution from the oil and gas industry. Clean Air Task Force, June. https://www.catf.us/resource/fossil-fumes-public-health-analysis/
[222] Fleischman et al. 2016b. Gasping for Breath: An analysis of the health effects from ozone pollution from the oil and gas industry. Clean Air Task Force, August. https://www.catf.us/resource/gasping-for-breath/
[223] Graham et al. 2017. Health Risks in US States from Oil and Gas Air Pollution. Clean Air Task Force, February. https://www.catf.us/resource/health-risks-in-us-states-from-oil-and-gas-air-pollution/
[224] See also Oil and Gas Threat Map 2.0. https://oilandgasthreatmap.com/
[225] Bouwes et al. 2003. Information for Empowerment: The EPA’s Risk-Screening Environmental Indicators Project. In Boyce & Shelley, eds., Natural Assets: Democratizing Environmental Ownership. Washington, DC: Island Press. https://books.google.com/books?hl=en&lr=&id=7SsN1vC8X5wC
[226] The term “minority” here refers to the collective group of racial and ethnic minorities in the United States, although in many regions this group constitutes a plurality or a majority of residents. The category includes anyone who does not identify as non-Hispanic White.
[227] Political Economy Research Institute (PERI). 2021. Top 100 Polluter Indexes. https://www.peri.umass.edu/top-100-polluter-indexes
[228] Donaghy 2021
[229] Ash et al. 2009. Tables 5 & 6.
[230] PERI 2021
[231] Fleischman & Franklin 2017.
[232] White et al. 2016. Double Jeopardy in Houston: Acute and Chronic Chemical Exposures Pose Disproportionate Risks for Marginalized Communities. Union of Concerned Scientists & t.e.j.a.s., October. https://www.ucsusa.org/sites/default/files/attach/2016/10/ucs-double-jeopardy-in-houston-full-report-2016.pdf
[233] Greenpeace. 2019. Throwing Away The Future: How Companies Still Have It Wrong on Plastic Pollution ‘Solutions.’ September. https://www.greenpeace.org/usa/research/how-companies-still-have-it-wrong-on-plastic-pollution-solutions/
[234] Mitchell, D. 2019. For massive new plants, Formosa wants OK to double amount of chemicals released into St. James Parish air. The Advocate, July 8. https://www.theadvocate.com/baton_rouge/news/article_c30d4620-a1be-11e9-837c-13f09466bb79.html
[235] U.S. EPA. National Air Toxics Assessment. 2014 NATA Map. https://www.epa.gov/national-air-toxics-assessment/2014-nata-map
[236] Carpenter & Wagner. 2019. Environmental justice in the oil refinery industry: A panel analysis across United States counties. Ecological Economics, 159, 101-109. https://www.sciencedirect.com/science/article/abs/pii/S092180091830586X
[237] Lynch et al. 2004. Determinants of Environmental Law Violation Fines Against Petroleum Refineries: Race, Ethnicity, Income, and Aggregation Effects. Soc. & Nat. Res., 17, 4, 333-347. https://www.tandfonline.com/doi/abs/10.1080/08941920490278782
[238] James et al. 2012. Uneven Magnitude of Disparities in Cancer Risks from Air Toxics. Int J Environ Res Public Health, 9, 12, 4365–4385 https://www.ncbi.nlm.nih.gov/pmc/articles/PMC3546767/
[239] Grineski & Collins. 2018. Geographic and social disparities in exposure to air neurotoxicants at U.S. public schools. Env. Research, 161, 580-587 https://www.sciencedirect.com/science/article/abs/pii/S0013935117317188
[240] U.S. Pipeline and Hazardous Materials Safety Administration. Petroleum Pipeline Systems. https://primis.phmsa.dot.gov/comm/PetroleumPipelineSystems.htm?nocache=9697
[241] Donaghy, T. & K. Stewart. 2017. Four Proposed Tar Sands Oil Pipelines Pose A Threat To Water Resources. Greenpeace USA. https://www.greenpeace.org/usa/research/four-proposed-tar-sands-oil-pipelines-pose-a-threat-to-water-resources/
[242] International Tanker Owners Pollution Federation (ITOPF). Oil Tanker Spill Statistics 2020. https://www.itopf.org/knowledge-resources/data-statistics/statistics/
[243] Margolis, J. 2015. Runaway Risks: Oil Trains and the Government’s Failure to Protect People, Wildlife and the Environment. Center for Biological Diversity, February. https://www.biologicaldiversity.org/campaigns/oil_trains/pdfs/runaway_risks_web.pdf
[244] Jaffe et al. 2015. Diesel particulate matter and coal dust from trains in the Columbia River Gorge, Washington State, USA. Atmospheric Pollution Research. 6, 6, 946-952. https://www.sciencedirect.com/science/article/abs/pii/S1309104215000057
[245] Johnson et al. 2014. Air quality and health issues along Houston’s Ship Channel: An exploratory environmental justice analysis of a vulnerable community (Pleasantville). Race, Gender & Class, 21, 3/4, 273–303. https://www.jstor.org/stable/43496996?seq=1
[246] Donaghy 2021
[247] Thorbecke, C. 2016. Why a Previously Proposed Route for the Dakota Access Pipeline Was Rejected. ABC News, November 3. https://abcnews.go.com/US/previously-proposed-route-dakota-access-pipeline-rejected/story?id=43274356
[248] Wraight et al. 2018. Environmental Justice Concerns and the Proposed Atlantic Coast Pipeline Route in North Carolina. RTI Press Publication No. MR-0037-1803. Research Triangle Park, NC. https://www.ncbi.nlm.nih.gov/books/NBK556154/
[249] Strube et al. 2021. Proposed Pipelines and Environmental Justice: Exploring the Association between Race, Socioeconomic Status, and Pipeline Proposals in the United States. Rural Sociology, in press. https://onlinelibrary.wiley.com/doi/full/10.1111/ruso.12367
[250] Farrow et al. 2020.
[251] Vohra et al. 2021
[252] Verma et al. 2016. Toxic Pollutants from Plastic Waste- A Review. Procedia Env. Sci., 35, 701-708. https://www.sciencedirect.com/science/article/pii/S187802961630158X
[253] Mikati et al. 2018
[254] Tessum et al. 2018. Inequity in consumption of goods and services adds to racial–ethnic disparities in air pollution exposure. PNAS, 116, 13, 6001-6006. https://www.pnas.org/content/116/13/6001
[255] Kadaba, D. 2017. Nothing to Wheeze At: Air Pollution’s Disproportionate Effect on Poor and Minority Communities. Revelator, December 15. https://therevelator.org/air-pollution-poor-minority-communities/
[256] Zhang et al. 2018
[257] Clay & Muller. 2019. Recent Increases in Air Pollution: Evidence and Implications for Mortality. NBER Working Paper 26381. https://www.nber.org/papers/w26381
[258] Colmer et al. 2020. Disparities in PM2.5 air pollution in the United States. Science, 369, 6503, 575-578. https://science.sciencemag.org/content/369/6503/575
[259] Miranda et al. 2011. Making the Environmental Justice Grade: The Relative Burden of Air Pollution Exposure in the United States. Int J Environ Res Public Health, 8, 6, 1755–1771. https://www.ncbi.nlm.nih.gov/pmc/articles/PMC3137995/
[260] Quintero et al. 2011. U.S. Latinos and Air Pollution: A Call to Action. NRDC, September. https://www.nrdc.org/sites/default/files/LatinoAirReport.pdf
[261] Donaghy 2021
[262] Rissman et al. 2020. Technologies and policies to decarbonize global industry: Review and assessment of mitigation drivers through 2070. Applied Energy, 266, 114848. https://www.sciencedirect.com/science/article/pii/S0306261920303603
[263] National Research Council. 2010. Hidden costs of energy: Unpriced consequences of energy production and use. Washington DC: The National Academies Press. http://www.nap.edu/catalog/12794/
[264] Machol & Rizk. 2013. Economic value of U.S. fossil fuel electricity health impacts. Environ. Int., 52, 75-80. https://pubmed.ncbi.nlm.nih.gov/23246069/
[265] Epstein et al. 2011
[266] U.S. EPA. Cleaner Power Plants. https://www.epa.gov/mats/cleaner-power-plants
[267] Gaffney, A. 2020. A Legacy of Contamination: How the Kingston coal ash spill unearthed a nuclear nightmare. Grist, December 15. https://grist.org/justice/tva-kingston-coal-ash-spill-nuclear/
[268] U.S. EPA. 2015. Regulatory Impact Analysis for the Clean Power Plan Final Rule. https://19january2017snapshot.epa.gov/sites/production/files/2015-08/documents/cpp-final-rule-ria.pdf
[269] U.S. EPA. 2015. Fact Sheet: Clean Power Plan By The Numbers. https://19january2017snapshot.epa.gov/cleanpowerplan/fact-sheet-clean-power-plan-numbers_.html
[270] Irfan, U. 2021. A federal court just struck down Trump’s attempt to make power plants even dirtier. Vox, January 19. https://www.vox.com/2021/1/19/22239074/affordable-clean-energy-rule-vacated-trump-court-climate-change-obama-biden
[271] Casey et al. 2018
[272] Casey et al. 2020. Improved asthma outcomes observed in the vicinity of coal power plant retirement, retrofit and conversion to natural gas. Nature Energy, 5, 398–408. https://www.nature.com/articles/s41560-020-0600-2
[273] Strasert et al. 2019. Air quality and health benefits from potential coal power plant closures in Texas. J. Air & Waste Manage. 69, 333–350. https://pubmed.ncbi.nlm.nih.gov/30339492/
[274] Perera et al. 2020. Co-Benefits to Children’s Health of the U.S. Regional Greenhouse Gas Initiative. Environmental Health Perspectives, 128, 7. https://ehp.niehs.nih.gov/doi/full/10.1289/EHP6706
[275] Diana, Ash & Boyce 2021.
[276] Specht, M. 2018. No, Natural Gas Power Plants Are Not Clean. Union of Concerned Scientists, November 9. https://blog.ucsusa.org/mark-specht/natural-gas-power-plants-are-not-clean
[277] Wilson et al. 2012. Coal Blooded: Putting Profits Before People. NAACP, Indigeneous Environmental Network & Little Village Environmental Justice Organization. https://www.naacp.org/wp-content/uploads/2016/04/CoalBlooded.pdf
[278] U.S. EPA. 2015. EJScreening Report for the Clean Power Plan. https://archive.epa.gov/epa/sites/production/files/2016-04/documents/ejscreencpp.pdf
[279] Massetti et al. 2017. Environmental Quality and the U.S. Power Sector: Air Quality, Water Quality, Land Use and Environmental Justice. ORNL/SPR-2016/772. https://info.ornl.gov/sites/publications/files/Pub60561.pdf
[280] PSE Healthy Energy. 2017. Natural gas power plants in California’s disadvantaged communities. April. https://www.psehealthyenergy.org/wp-content/uploads/2017/04/CA.EJ_.Gas_.Plants.pdf
[281] Food & Water Watch. 2018. Pernicious Placement of Pennsylvania Power Plants. June. https://www.foodandwaterwatch.org/insight/pernicious-placement-pennsylvania-power-plants
[282] Richmond-Bryant et al. 2020
[283] Diana, Ash & Boyce 2021.
[284] U.S. EPA. How Mobile Source Pollution Affects Your Health. https://www.epa.gov/mobile-source-pollution/how-mobile-source-pollution-affects-your-health
[285] Adar & Kaufman. 2007. Cardiovascular disease and air pollutants: evaluating and improving epidemiological data implicating traffic exposure. Inhal. Toxicol., 19 Suppl 1, 135-49. https://pubmed.ncbi.nlm.nih.gov/17886061/
[286] HEI Panel on the Health Effects of Air Pollution. 2010. Traffic-related air pollution: a critical review of the literature on emissions, exposure, and health effects. January. https://www.healtheffects.org/publication/traffic-related-air-pollution-critical-review-literature-emissions-exposure-and-health
[287] U.S. EPA. 2012. Regulatory Impact Analysis: Final Rulemaking for 2017-2025 Light-Duty Vehicle Greenhouse Gas Emission Standards and Corporate Average Fuel Economy Standards. Pp. 6-13 to 6-14, and 6-73 to 6-76. https://nepis.epa.gov/Exe/ZyPDF.cgi/P100EZI1.PDF?Dockey=P100EZI1.PDF
[288] Houser, T. et al. 2018. The Biggest Climate Rollback Yet? Rhodium Group, August 2. https://rhg.com/research/the-biggest-climate-rollback-yet/
[289] Wimberger, E. & H. Pitt. 2019. Come and Take It: Revoking the California Waiver. Rhodium Group, October 28. https://rhg.com/research/come-and-take-it-revoking-the-california-waiver/
[290] Environmental Defense Fund. 2018. Comments submitted on the Proposed Rule: The Safer Affordable Fuel-Efficient (SAFE) Vehicles Rule for Model Years 2021–2026 Passenger Cars and Light Trucks. November 4. https://www.regulations.gov/document?D=EPA-HQ-OAR-2018-0283-5775.
[291] E.g. Johnson, M. 2017. Undoing Oakland’s History of Environmental Racism as We Address Climate Change in California. Greenlining Institute, May 12. https://greenlining.org/blog-category/2017/undoing-oaklands-history-environmental-racism/
[292] See e.g. Stromberg, J. 2016. Highways gutted American cities. So why did they build them? Vox, May 11. https://www.vox.com/2015/5/14/8605917/highways-interstate-cities-history
[293] Nardone et al. 2020
[294] Hoffman et al. 2020
[295] Mielke et al. 2010. Lead (Pb) legacy from vehicle traffic in eight California urbanized areas: Continuing influence of lead dust on children’s health. Sci. Tot. Environ., 408, 19, 3965-3975. https://www.sciencedirect.com/science/article/abs/pii/S0048969710004900
[296] Rowangould 2013
[297] Park & Kwan. 2020. Understanding Racial Disparities in Exposure to Traffic-Related Air Pollution: Considering the Spatiotemporal Dynamics of Population Distribution. Int J Environ Res Public Health, 17, 3, 908. https://pubmed.ncbi.nlm.nih.gov/32024171/
[298] Tayarani & Rowangould. 2020. Estimating exposure to fine particulate matter emissions from vehicle traffic: Exposure misclassification and daily activity patterns in a large, sprawling region. Env. Research, 182, 108999. https://www.sciencedirect.com/science/article/abs/pii/S0013935119307960
[299] Lena et al. 2002. Elemental carbon and PM2.5 levels in an urban community heavily impacted by truck traffic. Environmental Health Perspectives, 110, 1009-1015. https://ehp.niehs.nih.gov/doi/abs/10.1289/ehp.021101009
[300] Wier et al. 2009. Health, traffic, and environmental justice: collaborative research and community action in San Francisco, California. American Journal of Public Health, 99, S499-S504. https://ajph.aphapublications.org/doi/full/10.2105/AJPH.2008.148916
[301] Houston et al. 2014. Disparities in Exposure to Automobile and Truck Traffic and Vehicle Emissions Near the Los Angeles–Long Beach Port Complex. American Journal of Public Health. 104, 1, 156–164. https://www.ncbi.nlm.nih.gov/pmc/articles/PMC3910024/
[302] Watts et al. 2020. The 2020 report of The Lancet Countdown on health and climate change: responding to converging crises. Lancet, 397, 10269, P129-170. https://www.thelancet.com/journals/lancet/article/PIIS0140-6736(20)32290-X/fulltext
[303] Salas et al. 2020. 2020 Lancet Countdown on Health and Climate Change Policy Brief for the United States of America. Lancet, December. http://www.lancetcountdownus.org/wp-content/uploads/2020/12/FINAL-2020_12_02_Lancet-Countdown-Policy-Document-USA-ENG.pdf
[304] Watts et al. 2020
[305] Rojas et al. 2019. Emergence of robust precipitation changes across crop production areas in the 21st century. PNAS, 116, 14, 6673-6678. https://www.pnas.org/content/116/14/6673
[306] IPBES. 2019. Summary for policymakers of the global assessment report on biodiversity and ecosystem services of the Intergovernmental Science-Policy Platform on Biodiversity and Ecosystem Services. Diaz et al. eds. https://www.ipbes.net/global-assessment
[307] Ebi et al. 2018. Chapter 14: Human Health. In Impacts, Risks, and Adaptation in the United States: Fourth National Climate Assessment, Volume II, Reidmiller et al., eds. U.S. Global Change Research Program. https://nca2018.globalchange.gov/chapter/14/
[308] Martinich, J. & A. Crimmins. 2019. Climate damages and adaptation potential across diverse sectors of the United States. Nature Climate Change, 9, 397–404. https://www.nature.com/articles/s41558-019-0444-6
[309] Burke, M. & S. Heft-Neel. 2020. Indirect mortality from recent wildfires in CA. http://www.g-feed.com/2020/09/indirect-mortality-from-recent.html
[310] Climate Attribution Database. https://climateattribution.org/
[311] U.S. National Oceanic and Atmospheric Administration (NOAA). Billion-Dollar Weather and Climate Disasters: Overview. https://www.ncdc.noaa.gov/billions/
[312] Im et al. 2017. Deadly heat waves projected in the densely populated agricultural regions of South Asia. Science Advances, 3, 8, e1603322. https://advances.sciencemag.org/content/3/8/e1603322
[313] Ebi et al. 2018
[314] Hsiang et al. 2017. Estimating economic damage from climate change in the United States. Science, 356, 6345, 1362-1369. https://science.sciencemag.org/content/356/6345/1362
[315] Alston, P. 2019. Climate change and poverty : report of the Special Rapporteur on Extreme Poverty and Human Rights. United Nations Human Rights Council, July. https://digitallibrary.un.org/record/3810720?ln=en
[316] Associated Press. 2017. Poor, Southern counties are most at risk. https://interactives.ap.org/climate-change-economic-damage/
[317] Sager, L. 2019. Income inequality and carbon consumption: Evidence from Environmental Engel curves. Energy Economics, 84, 1, 104507. https://www.sciencedirect.com/science/article/pii/S0140988319302968
[318] Rudolph et al. 2018. Climate Change, Health, and Equity: A Guide for Local Health Departments. Oakland, CA and Washington D.C.: Public Health Institute and American Public Health Association. https://www.apha.org/topics-and-issues/climate-change/guide
[319] U.S. Climate Resilience Toolkit. Relocating Kivalina. https://toolkit.climate.gov/case-studies/relocating-kivalina
[320] Davenport, C. & C. Robertson. 2016. Resettling the First American ‘Climate Refugees. New York Times, May 3. https://www.nytimes.com/2016/05/03/us/resettling-the-first-american-climate-refugees.html
[321] Garcia-Lopez, G. 2018.The multiple layers of environmental injustice in contexts of (un)natural disasters: the case of Puerto Rico post- Hurricane Maria. Environmental Justice, 11, 3, 101-108. https://www.liebertpub.com/doi/10.1089/env.2017.0045
[322] Kiaghadi & Riafi. 2019. Physical, Chemical, and Microbial Quality of Floodwaters in Houston Following Hurricane Harvey. Environ. Sci. Technol., 53, 9, 4832–4840. https://pubs.acs.org/doi/10.1021/acs.est.9b00792
[323] Subramanian et al. 2018. Air Quality in Puerto Rico in the Aftermath of Hurricane Maria: A Case Study on the Use of Lower Cost Air Quality Monitors. ACS Earth Space Chem., 2, 11, 1179–1186. https://pubs.acs.org/doi/10.1021/acsearthspacechem.8b00079
[324] Horney et al. 2018. Comparing residential contamination in a Houston environmental justice neighborhood before and after Hurricane Harvey. PLoS One, 13, 2, e0192660 https://journals.plos.org/plosone/article?id=10.1371/journal.pone.0192660
[325] Lancet Countdown. 2020. Case Study: Compounding Crises of Our Time During Hurricane Laura: Climate Change, COVID-19, and Environmental Injustice. http://www.lancetcountdownus.org/wp-content/uploads/2020/12/cs-compounding.pdf
[326] Chakraborty et al. 2019. Disproportionately higher exposure to urban heat in lower-income neighborhoods: a multi-city perspective. Environ. Res. Lett., 14, 105003. https://iopscience.iop.org/article/10.1088/1748-9326/ab3b99
[327] Hsu et al. 2020. Disproportionate Exposure to Urban Heat Island Across Major U.S. Cities. SSRN. https://ssrn.com/abstract=3684952
[328] Benz, S. & J. Burney. 2021. Widespread Race and Class Disparities in Surface Urban Heat Extremes Across the United States. OSF Preprints. https://osf.io/r5svd
[329] Hoffman et al. 2020
[330] Katz, L. 2021. A Racist Past, a Flooded Future: Formerly Redlined Areas Have $107 Billion Worth of Homes Facing High Flood Risk—25% More Than Non-Redlined Areas. Redfin, March 14. https://www.redfin.com/news/redlining-flood-risk/
[331] Bekkar et al. 2020
[332] Schleeter, R., A. Moas & T. Donaghy. 2020. Greenpeace USA’s Just Recovery Agenda: A pathway to a new economy. Greenpeace USA, November. https://www.greenpeace.org/usa/reports/just-recovery-agenda/
[333] Demos. 2020. Frontlines climate justice executive action platform. July. https://www.demos.org/policy-briefs/frontlines-climate-justice-executive-action-platform
[334] Evergreen & Demos. 2020. Designing a New National Equity Mapping Program. October. https://www.demos.org/policy-briefs/designing-new-national-equity-mapping-program
[335] 116th Congress. 2020. Environmental Justice for All Act. H.R.5986. https://www.congress.gov/bill/116th-congress/house-bill/5986; S.4401. https://www.congress.gov/bill/116th-congress/senate-bill/4401
[336] 116th Congress. 2020. Climate Equity Act of 2020. H.R.8019. https://www.congress.gov/bill/116th-congress/house-bill/8019; S.4513. https://www.congress.gov/bill/116th-congress/senate-bill/4513
[337] 116th Congress. 2020. End Polluter Welfare Act of 2020. H.R.7781. https://www.congress.gov/bill/116th-congress/house-bill/7781
[338] Donaghy, T., J. Noël & L. Stockman. 2020. Policy briefing: Carbon impacts of reinstating the U.S. crude export ban. Greenpeace USA & Oil Change International, January. https://www.greenpeace.org/usa/reports/carbon-impacts-of-reinstating-the-us-crude-export-ban/
[339] Last Chance Alliance. 2019. Our last chance: Phasing out fossil fuels. California Oil & Gas Policy Brief. https://lastchancealliance.org/wp-content/uploads/2019/07/California-Oil-and-Gas-Policy-Brief-Last-Chance-Alliance.pdf
[340] Donaghy, T. 2020. Remediation of orphan oil & gas wells in COVID-19 stimulus. Greenpeace USA, April. https://www.greenpeace.org/usa/research/policy-briefing-remediation-of-orphan-oil-gas-wells-in-covid-19-stimulus/
[341] Jiang, C. 2020. Protecting energy workers and communities in a just COVID-19 recovery. Greenpeace USA, April. https://www.greenpeace.org/usa/research/policy-briefing-protecting-energy-workers-and-communities-in-a-just-covid-19-recovery/
[342] THRIVE Agenda. A bold plan for economic renewal: Creating millions of jobs for a just, healthy, and equitable society. https://www.thriveagenda.com/
[343] 117th Congress. 2021. For the People Act of 2021. H.R.1. https://www.congress.gov/bill/117th-congress/house-bill/1
[344] 116th Congress. 2020. Voting Rights Advancement Act of 2019. H.R.4. https://www.congress.gov/bill/116th-congress/house-bill/4
[345] 117th Congress. 2021. Washington, D.C. Admission Act. H.R.51. https://www.congress.gov/bill/117th-congress/house-bill/51
[346] 116th Congress. 2019. Democracy for All Amendment. H.J.Res.2. https://www.congress.gov/bill/116th-congress/house-joint-resolution/2/text; Harris, Kamala D. Harris, Feinstein, Senate Democrats introduce constitutional amendment to overturn Citizens United. https://www.harris.senate.gov/news/press-releases/harris-feinstein-senate-democrats-introduce-constitutional-amendment-to-overturn-citizens-united
[347] The BREATHE Act. (n.d.). https://breatheact.org/wp-content/uploads/2020/07/The-BREATHE-Act-PDF_FINAL3-1.pdf