
From the NASA Scientific Visualization Studio
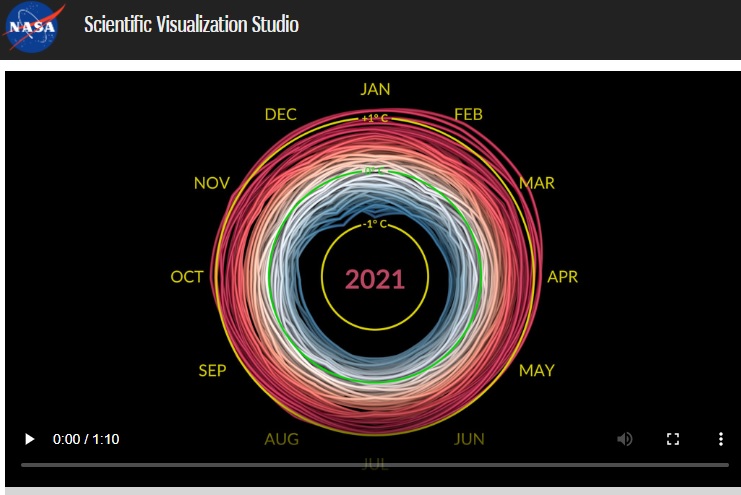
The video shows Earth’s warming from 1880 to 2021 with red spirals indicating warmer than average years.
GISTEMP Climate Spiral
The data file used to create this visualization can be accessed here.
The Goddard Institute of Space Studies (GISS) is a NASA laboratory managed by the Earth Sciences Division of the agency’s Goddard Space Flight Center in Greenbelt, Maryland. The laboratory is affiliated with Columbia University’s Earth Institute and School of Engineering and Applied Science in New York.
The ‘climate spiral’ is a visualization designed by climate scientist Ed Hawkins from the National Centre for Atmospheric Science, University of Reading. Climate spiral visualizations have been widely distributed, a version was even part of the opening ceremony of the Rio de Janeiro Olympics.